Материал: 2016_Kaplan_USMLE_Step_1_Lecture_Notes_Pharmacology
Section I l General Principles
Bridge to Renal Physiology
Inulin clearance is used to estimate GFR because it is not reabsorbed or secreted. A normal GFR is close to 120 mL/min.
Note
MD = Css × Cl × τ
f
See legend on page 16.
Classic Clues
Time and Steady State
50% = 1 × half-life
90% = 3.3 × half-life
95% = 4–5 × half-life
“100”% = >7 × half-life
Renal Elimination
●Rate of elimination = glomerular filtration rate (GFR) + active secretion
–reabsorption (active or passive).
●Filtration is a nonsaturable linear function. Ionized and nonionized forms of drugs are filtered, but protein-bound drug molecules are not.
●Clearance (Cl):
–Definition: volume of blood cleared of drug per unit of time
–Cl is constant in first-order kinetics
–Cl = GFR when there is no reabsorption or secretion and no plasma protein binding
–Protein-bound drug is not cleared; Cl = free fraction × GFR
STEADY STATE
●Steady state is reached either when rate in = rate out or when values associated with a dosing interval are the same as those in the succeeding interval.
Plateau Principle
The time to reach steady state is dependent only on the elimination half-life of a drug and is independent of dose size and frequency of administration, assuming the drug is eliminated by first-order kinetics.
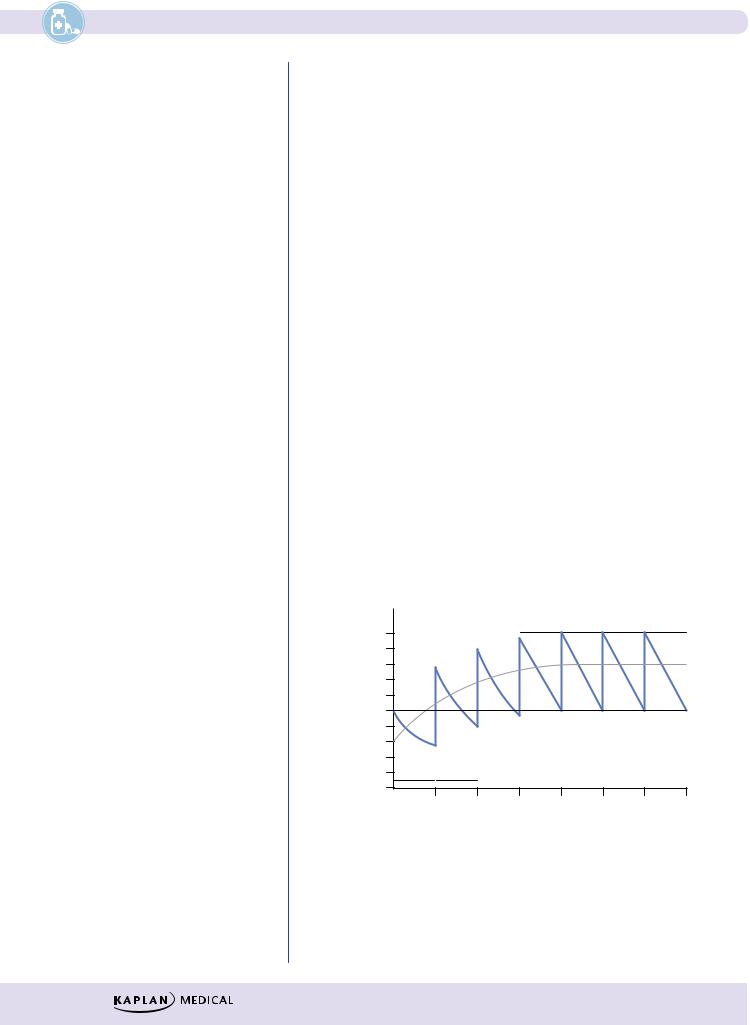
Figure I-1-11 shows plasma levels (solid lines) achieved following the IV bolus administration of 100 units of a drug at intervals equivalent to every half-life t1/2= 4 h (τ). With such intermittent dosing, plasma levels oscillate through peaks and troughs, with averages shown in the diagram by the dashed line.
Concentration |
200 |
|
|
|
|
|
|
Cssmax |
(peak) |
120 |
|
|
|
|
|
|
|
|
|
|
180 |
|
|
t1/2 |
t1 |
/2 |
t1/2 |
t1/2 |
Cssav |
|
160 |
|
t1/2 |
|
|
|
|||
(µg/ml) |
140 |
t1/2 |
|
|
|
|
Cssmin |
|
|
80 |
|
88/188 |
94/194 |
97/197 |
(trough) |
||||
Drug |
100 |
|
|
|
|
|
|
|
|
60 |
|
75/175 |
|
|
|
99/199100/200 |
|||
Plasma |
40 |
50/150 |
|
|
|
|
|
|
|
|
20 |
τ |
τ |
|
|
|
|
|
|
|
0 |
4 |
8 |
12 |
|
16 |
20 |
24 |
30 |
|
|
|
|||||||
|
|
|
|
Time (h) |
|
|
|
||
Figure I-1-11. Oscillations in Plasma Levels following IV Bolus Administration at Intervals Equal to Drug Half-Life
Note: Although it takes >7 t1/2 to reach mathematical steady state, by convention clinical steady state is accepted to be reached at 4–5 t1/2.
14
Chapter 1 l Pharmacokinetics
Rate of Infusion
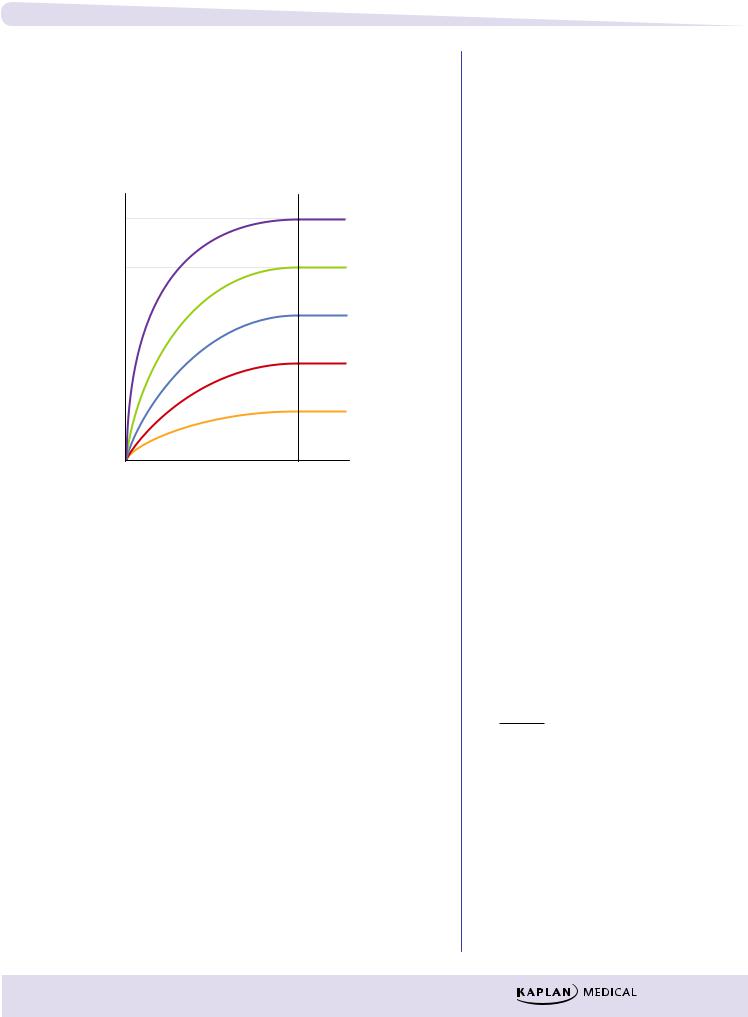
Figure I-1-12 shows the increases in plasma levels of the same drug infused at five different rates. Regardless of the rate of infusion, it takes the same amount of time to reach steady state.
All have the same time to plateau
5 mg/min
Concentration |
4 mg/min |
|
|
|
3 mg/min |
|
2 mg/min |
|
|
|
1 mg/min |
Time
Figure I-1-12. Effect of Rate of Infusion on Plasma
Note
●Remember that dose and plasma concentration (CSS) are directly proportional.
Rate of infusion (k0) does determine plasma level at steady state. If the rate of infusion is doubled, then the plasma level of the drug at steady state is doubled. A similar relationship can exist for other forms of drug administration (e.g., per oral)—doubling oral doses can double the average plasma levels of a drug. Plotting dose against plasma concentration yields a straight line (linear kinetics).
Effect of Loading Dose
●It takes 4–5 half-lives to achieve steady state.
●In some situations, it may be necessary to give a higher dose (loading dose) to more rapidly achieve effective blood levels (Cp).
Note
LD = Vd × Cp f
15
Section I l General Principles
Clinical Correlate
The loading dose equation can be used to calculate the amount of drug in the body at any time by knowing the Vd and the plasma concentration.
level |
|
Minimum |
Plasma |
|
|
|
level |
|
|
|
|
|
0 |
|
|
0 |
Time |
|
|
|
|
Doses |
|
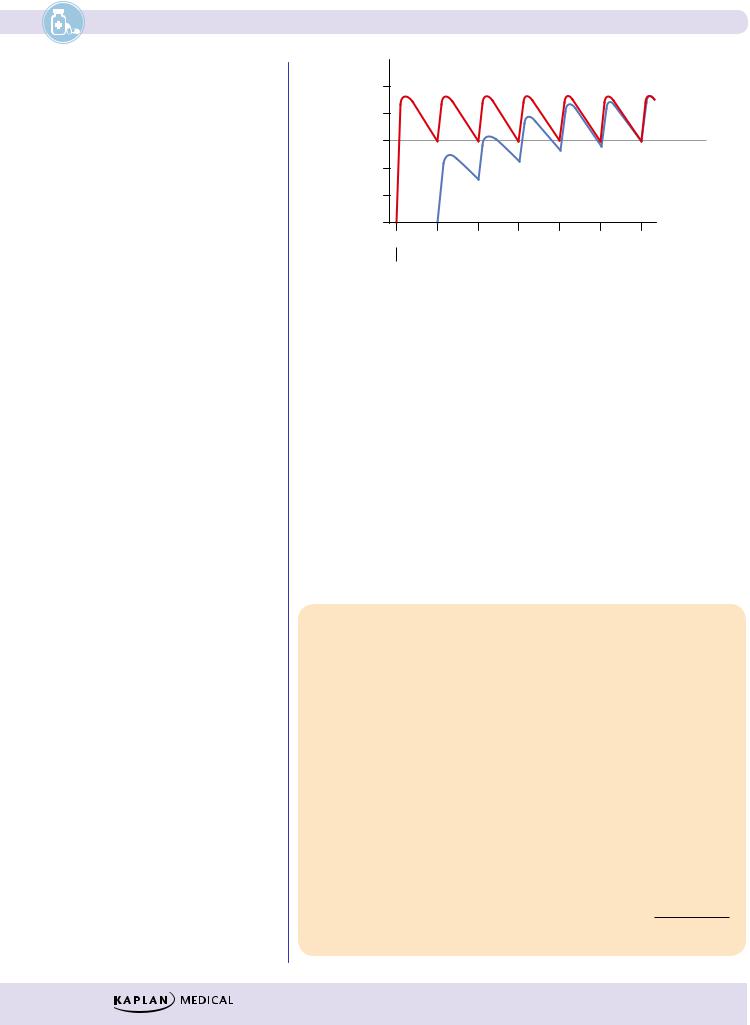
Figure I-1-13. Effect of a Loading Dose on the Time Required to Achieve the Minimal Effective Plasma Concentration
●Such loading doses are often one time only and (as shown in Figure I-1- 13) are estimated to put into the body the amount of drug that should be there at a steady state.
●For the exam, if doses are to be administered at each half-life of the drug
and the minimum effective concentration is equivalent to CSSmin, then the loading dose is twice the amount of the dose used for maintenance (assuming normal clearance and same bioavailability for maintenance doses). For any other interval of dosing, Equation 4 (below) is used.
Legend
C0 = conc. at time zero
Cl = clearance
Cp = conc. in plasma
Css = steady state conc.
D = dose
f = bioavailability
k0 = infusion rate
LD = loading dose
MD = maintenance dose
τ = dosing interval
Vd = volume of distribution
IMPORTANT PHARMACOKINETICS CALCULATIONS
The following five relationships are important for calculations:
Single-Dose Equations
(1) |
Volume of distribution ( V ) |
V = |
D |
|
||
C0 |
||||||
|
d |
d |
||||
(2) |
Half-life (t1/2 ) |
t1/2 = 0.7 × |
Vd |
|||
Cl |
||||||
Multiple Doses or Infusion Rate Equations
(3)Infusion rate (k0 )
(4)Loading dose (LD)
(5)Maintenance dose (MD)
k0 = Cl × Css
LD = |
Vd × Cp |
|
f |
||
|
MD = Cl × CSS × τ
f
16

Chapter 1 l Pharmacokinetics
Chapter Summary
●The pharmacokinetic characteristics of a drug are dependent upon the processes of absorption, distribution, metabolism, and excretion. An important element concerning drug biodistribution is permeation, which is the ability to cross membranes, cellular and otherwise.
●A drug’s ability to permeate is dependent on its solubility, the concentration gradient, and the available surface area, which is influenced by the degree of vascularity. Ionization affects permeation because unionized molecules are minimally water soluble but do cross biomembranes, a feat beyond the capacity of ionized molecules. Figure I-1-2 illustrates the principles associated with ionization; Table I-1-1 summarizes the three basic modes of transport across a membrane: passive, facilitated, and active.
●Absorption concerns the processes of entry into the systemic circulation. Except for the intravascular route, some absorptive process is always involved. These have the same determinants as those of permeation.
Because absorption may not be 100% efficient, less than the entire dose administered may get into the circulation.
●Any orally administered hydrophilic drug will be absorbed first into the portal vein and sent directly to the liver, where it may be partially deactivated. This is the first-pass effect.
●The distribution of a drug into the various compartments of the body is dependent upon its permeation properties and its tendency to bind to plasma proteins. The placental and blood–brain barriers are of particular importance
in considering distribution. The Vd is a kinetic parameter that correlates the dose given to the plasma level obtained: the greater the Vd value, the less the plasma concentration.
●As well as having the ability to cross the blood–brain barrier, lipophilic drugs have a tendency to be deposited in fat tissue. As blood concentrations fall, some of this stored drug is released. This is called redistribution. Because with each administration more lipophilic drug is absorbed into the fat, the duration of action of such a drug increases with the number of doses until the lipid stores are saturated.
●Biotransformation is the metabolic conversion of drugs, generally to less active compounds but sometimes to iso-active or more active forms. Phase I biotransformation occurs via oxidation, reduction, or hydrolysis. Phase II metabolism occurs via conjugation.
●The cytochrome P-450 isozymes are a family of microsomal enzymes that collectively have the capacity to transform thousands of different molecules. The transformations include hydroxylations and dealkylations, as well as the promotion of oxidation/reduction reactions. These enzymes have an absolute
requirement for NADPH and O2. The various isozymes have different substrate and inhibitor specificities.
●Other enzymes involved in phase I reactions are hydrolases (e.g., esterases and amidases) and the nonmicrosomal oxidases (e.g., monoamine oxidase and alcohol and aldehyde dehydrogenase).
(Continued )
17
Section I l General Principles
Chapter Summary (cont’d )
●Phase II reactions involve conjugation, sometimes after a phase I hydroxylation. The conjugation may be glucuronidation, acetylation, sulfation, or addition of glutathione.
●Modes of drug elimination are biotransformation, renal excretion, and excretion by other routes (e.g., bile, sweat, lungs, etc.). Most drugs follow first-order elimination rates. Figures I-1-9a and I-1-9b compare zeroand
first-order elimination, and Figure I-1-10 demonstrates how the t1/2 and the theoretical zero time plasma concentration (C0) can be graphically determined. An important relationship is dose = Vd × C0.
●Renal clearance (ClR) represents the volume of blood cleared by the kidney per unit time and is a constant for drugs with first-order elimination kinetics.
Total body clearance equals renal plus nonrenal clearance. An important relationship is Cl = k × Vd.
●A steady state is achieved when the rate coming in equals the rate going out. The time to reach a steady state is dependent only on the elimination half-life. It is independent of dose and frequency of administration or rate of infusion (see Figures I-1-11, -12, and -13).
●Other equations describing relationships important for calculation are those used to determine the loading dose, infusion rate, and maintenance dose.
18