Дипломная (вкр): Predicting completion of cash acquisitions using option implied risk-neutral probabilities
Predicting completion of cash acquisitions using option implied risk-neutral probabilities
National Research
University - Higher School of EconomicsCollege of Economics and Finance
Graduation Thesis
Predicting completion of
cash acquisitions using option implied risk-neutral probabilities
Author:Andreeva
Supervisor:Dr.
Sergey Gelman
. June 16, 2015
Introduction
In the year 2014 global Mergers and Acquisition activity
experienced an outstanding jump with over 40 000 transactions and total value
of approximately $ 3,5 billion. This corresponds to a 47% increase compared to
year 2013 and also is the seven-year high since 2007. The significantly
increased M&A activity might again raise demand for academic research on
the topic, in particular, on sources of risk involved in the deal. Deal failure
is widely accepted to be the key risk factor and, therefore, accurate estimates
of the probability of success could potentially be of interest to a broad
audience that is concerned with outcomes of pending transactions. The list of
interested parties includes target and the acquirer, banks, hedge funds and
asset management firms, individual investors and many others. the acquisition
offer is made target company’s stock price movements, as indicated by Samuelson
and Rosenthal (1986), collect the market expectations of the ultimate deal
outcome. However, market often misperceives and reacts with a price increase
even for failed deals. The topic that was widely studied in recent financial
literature is the reaction of options market to M&A announcements. This
paper examines the predictive power of option prices after the deal announcement
in relation to forecasting the outcome of cash corporate takeovers and compares
it with a more commonly accepted probability measure based on stock market
reaction. The key contribution of this research is the proposed method that
estimates risk-neutral probability of success from option prices of the target
company and the empirical testing of its forecasting ability. The approach is
based on the relationship between risk-neutral cumulative density function and
the first derivative of option price with respect to strike price that was
discovered by Breeden and Litzenberger (1978). Estimation of risk-neutral CDF
for specific intervals uses first-difference approximation highlighted by
Gelman (2005). To my knowledge, this is the first work that directly relates
these probability estimates to M&A deal success or failure and tests their
predictive power. study of option-implied probabilities of success leads to a
conclusion that option prices after announcement are indeed a worthy predictor
of the deal’s outcome. For the analysed sample risk-neutral probabilities
outperform stock-implied probabilities in terms of forecasting power for the
period of 3 weeks after the deal announcement. However, the empirical analysis
also reveals that despite being a good predictor, option-implied probabilities
tend to underestimate the success rate of the announced deals, which may lead
to potential arbitrage opportunities in the option market. This study also
briefly examines merger arbitrage strategies on the stock market and the
dependence of excess returns on the risk-neutral probability estimates. paper
is structured as follows: it starts with an overview of existing financial
literature on related topics that include studies of stock and option markets
behaviour after the deal announcement and its implication to deal outcome
predictability, analysis of merger arbitrage and associated excess returns and
papers that develop pricing models for options of target companies. Next
chapter is devoted to the derivation of the model used to estimate risk-neutral
probabilities and the rational for its application. The paper continues with a
summary of data selection process and key features of the obtained sample.
Methodology section that follows up provides a description of forecast
performance estimation and hypothesis testing procedures. Finally, last section
summarizes empirical results of predictive power assessment for risk-neutral
probabilities as well as their comparisons with stock-implied probabilities
defined as in Samuelson and Rosenthal (1986).
Literature overview
Mergers and acquisitions are, perhaps, the most heavily
studied topic in corporate finance. However, the literature that studies the
source of uncertainty for M&A deals is relatively scares, as most of the works
concentrate on determining value and wealth effects as well as their drivers.
the first steps in academic research that investigates M&A deal success
probability were taken in 1980s following the boom of M&A activity driven
by private equity firms. Brown and Raymond (1986) proposed a method of
estimating success probability based on a fallback price that they assumed to
be equal to the pre-announcement price (on average over a number of weeks). A
more sophisticated approach was outlined by Samuelson and Rosenthal (1986).
They focused on the study of cash corporate takeovers and started with the
empirical formula for the after announcement stock price as a function of
future stock price in case of deal’s success (offer price) and failure (some
fallback price). Then, following the assumption that success probability and
fallback price are constant for at least some time-intervals, they employ an
econometric method to forecast the fallback price and, thus, the success
probability. However, they didn’t distinguish between risk-neutral and actual
probabilities. The conclusion of their paper is that uncertainties involved in
takeovers are reflected well by the stock market and that market’s forecasts
improve monotonically with time. Both of the mentioned works allow for a
calculation of success probability using stock price data through out the
announcement period (from the announcement to the resolution day) and, thus,
can generate a sequence of probabilities. Regarding this matter they can be
contrasted with a study of Walkling (1985) that develops a multivariate technic
created for the purpose of a single estimation around the announcement date.
This paper was greatly influenced by Samuelson and Rosenthal’s work and mainly
follows its footsteps in the framework of methodology used to access
probabilistic forecasts. and Rosenthal as well as Brown and Raymond focus only
on the stock market price movements and ignore the effect of proposed
acquisitions on derivatives market, options in particular. Jayamaran, Mandelker
and Shastri (1991) were among the first to show that strong inferences
regarding M&A activity can be drawn from option prices. Conclusion they
reached is that implied volatilities for target companies increased
significantly prior to the announcement, suggesting that market anticipated a
takeover bid. Levy and Yoder (1993) reached the same conclusion, pointing out
that option-implied standard deviations for the target firm rise drastically 3
days before the deal announcement. Adesi et al. (1994) pioneered with
investigating post-announcement option volatilities to infer predictions
regarding resolution date. More recent work by Wang (2009) replicates their
approach to draw inferences regarding market’s assessment of the deal’s success
probability. In his work he constructs a volatility ratio of the observed
implied volatility to the fallback volatility that is taken as historical
average and shows that for the failed deals the ratio converges to one, while
for successful it does not.works that focus on option pricing in the time of
the expected M&A deal include the paper by Subramanian (2004) and Martinez
(2009). In their studies Subramanian develops an arbitrage-free model to price
options in stock-for-stock deals, while Martinez focuses on option pricing for
cash tender offers. Subramanian exploits a theoretically perfect correlation
between acquirer’s and target’s stock price in stock-for-stock deals and solves
the model by imposing assumptions that fallback price follows a given basket of
securities and that arrival process in a Poisson process with constant
intensity determines risk-neutral probability. The paper by Martinez is of
particular interest due to its close relation with the topic of this paper, as
the developed formula for option pricing allows
recovering both, risk-neutral success probability and the fallback price.
Moreover, Martinez compares estimated option-implied success probabilities to
the commonly used “naïve” ones obtained using the approach of Brown and Raymond (1986)
and arrives at conclusion that risk-neutral probabilities are a better
predictor of offer’s outcome. and Pulvino (2001) examined risk and return in
risk arbitrage and demonstrated that risk arbitrage returns are positively
correlated with market returns in severely depreciating markets, but
uncorrelated with market returns in flat or appreciating markets. Baker and
Savasoglu (2002) reported that a diversified portfolio of risk arbitrage
positions generate a modest abnormal return of 0,6%-0,9% per month and, most
importantly to this study, that returns to risk arbitrage increase in ex ante
prediction of completion risk. recover risk-neutral probabilities from option
prices this paper follows the approach by Breeden and Litzenberger (1978) that
exploits the relationship between second derivative of option price with
respect to strike price and risk-neutral PDF. One of the first academic works
that related this method of risk-neutral PDF derivation with approximation of
CDF for specific intervals using first and second differences was the paper by
Basset (1997). He used the above-mentioned non-parametric method to bind the
set of probability distributions. In 2005 Gelman applied the same binding
procedure to recover probability intervals for options of a target company that
was undergoing an M&A and compared them with Black-Scholes probability
distributions. Conclusion of his paper was that is worth noting that financial
literature that studies derivation of risk-neutral probability density
functions from option prices accounts for a vast amount of works. Rubenstein
(1994) used the non-parametric binomial trees technique. Risk-neutral
probabilities in this paper are estimated by minimizing the sum of squared
deviations between risk-neutral probabilities associated with binominal stock
price at maturity and the prior risk-neutral probabilities, conditioning on the
restriction that generated probabilities price options and the underlying asset
in such a way that they lie in the existing bid-ask spread. Jackwerth and
Rubinstein (1996) further extended this approach and introduced smoothens
criteria.
Model
theorem of asset pricing states that in a complete market a
derivative’s price should equal to the discounted expected value of its future
payoff under unique risk-neutral measure. Cox and Ross (1976) showed that a
European call option in continuous time could be priced as follows:

 - price of the underlying asset at time t, T=t+
 - expiration date, K - strike price,
 -risk-free rate,
  - risk-neutral probability density
function. shown by Breeden and Litzenberger (1978) the risk-neutral probability
distribution can be recovered from the option price via differentiation. Taking
the first derivative with respect to strike price yields us:
- risk-neutral probability density
function. shown by Breeden and Litzenberger (1978) the risk-neutral probability
distribution can be recovered from the option price via differentiation. Taking
the first derivative with respect to strike price yields us:
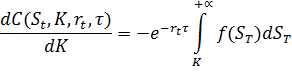
PDF properties and rearranging the equation we can express
the first-order derivative as a function of the cumulative density function of
the risk-neutral distribution and get a direct dependents between “exercise
price delta” and risk-neutral CDF:

CDF is always less or equal to 1 it follows:
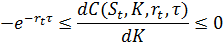
arbitrage condition then is that first derivative of the call
price function with respect to strike price should be negative but greater than
 . In other words, price of a call
should be a decreasing function of strike price, but the fall should be less or
equal to the discounted value of the strike price increase.risk neutral CDF and
differentiating once again will yield us PDF that is proportionate to the
second derivative of option’s price to strike price:
. In other words, price of a call
should be a decreasing function of strike price, but the fall should be less or
equal to the discounted value of the strike price increase.risk neutral CDF and
differentiating once again will yield us PDF that is proportionate to the
second derivative of option’s price to strike price:
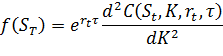
implies that call price function is convex with respect to
strike price as PDF is non-negative. Any local non-convexity would generate
negative risk-neutral probabilities and would, therefore, violate the
no-arbitrage condition.the above-mentioned equations the risk-neutral PDF can
be easily estimated from call prices. Many different techniques have been
developed to do so. Generally, these techniques can be divided into 2 different
approaches. First approach is to assume PDF to be of some kind of functional
form and then directly use equation 1) to fit the resulting theoretical option
prices to observed ones in order to estimate the free parameters in the
distribution. However, this approach is very restrictive and relies on the
assumption regarding PDF distribution. Second, non-parametric approach is much
more preferable. It uses equation 5) to derive risk-neutral PDF. However,
strike price distribution is, in fact, not continuous. Thus, non-parametric
techniques use interpolation and extrapolation to obtain continuous option
pricing function and then differentiate it in order to derive risk-neutral PDF.
Numerous approaches to interpolation have been developed: Shimko (1993) fitted
the volatility smile with polynomials, Jackwerth and Rubenstein (1996) used
quadratic approximation, Ait-Sahalia and Lo (1998) exploited kernel
regressions, while Bliss and Panigirtzoglou (2002) fitted the volatility smile
with cubic spline. Unfortunately, none of the above listed approaches is
applicable in case of expected M&A deal due to violation of continuity of
probabilities of different states and other necessary assumptions. it up, the
most appropriate way to deal with strike price discontinuity in our case, as
mentioned by Gelman (2005), is to approximate the derivatives through first and
second differences:


that delta in strike prices is the same for both,  and
and  . This assumption is, in fact,
usually satisfied with rare exceptions for deep out-of-the-money or
in-the-money options., risk-neutral CDF can be approximated as:
. This assumption is, in fact,
usually satisfied with rare exceptions for deep out-of-the-money or
in-the-money options., risk-neutral CDF can be approximated as:

PDF as:

Finally, the probability of a stock price to fall into the
interval between  and
and  at option's maturity is:

equation above provides a simple and elegant way to
approximate the risk-neutral probability of the stock price to lie in a certain
interval at a specified moment of time, maturity of the option. In application
to expected M&A deal this approach allows us to estimate risk-neutral
probability of the offer’s success. The rational behind this conclusion is as
follows: if the acquisition offer is successful, target shares will trade at a
price equal or very close to the offer bid before being delisted. If, on the
contrary, deal was unsuccessful prices will settle at the new “fallback” level.
Therefore, if we were to choose 3 options:  and
and  with maturity date that is close to,
but after deal's resolution and strike prices such that offer price per share
lies exactly between and , we would be able to forecast the success probability and
outcome of the announced deal using option-implied risk-neutral probabilities.
, this approach has some serious limitations that should be mentioned. Firstly
and most importantly, it requires the resolution date to be known in advance
which is a rare thing in M&A announcements. Thus, for it to be practically
applicable in deal outcome forecasting we will require some sort of estimate
for the resolution date. Secondly, first and second difference approximation
does not insure non-violation of no-arbitrage conditions. For some
discretionary data we can obtain probabilities that would be negative or
greater than one. In this paper this problem will be further discussed in
methodology section. Moreover, we can't get the probability estimates for
intervals other than ;
with maturity date that is close to,
but after deal's resolution and strike prices such that offer price per share
lies exactly between and , we would be able to forecast the success probability and
outcome of the announced deal using option-implied risk-neutral probabilities.
, this approach has some serious limitations that should be mentioned. Firstly
and most importantly, it requires the resolution date to be known in advance
which is a rare thing in M&A announcements. Thus, for it to be practically
applicable in deal outcome forecasting we will require some sort of estimate
for the resolution date. Secondly, first and second difference approximation
does not insure non-violation of no-arbitrage conditions. For some
discretionary data we can obtain probabilities that would be negative or
greater than one. In this paper this problem will be further discussed in
methodology section. Moreover, we can't get the probability estimates for
intervals other than ;  which can be quite large and, thus, possibly include the
fallback price that the stock settles to in case of the deal’s failure.
Finally, this approach requires Target Company to have option with matching
maturities and strike price that are sufficiently liquid. This limits the
practical application of the method, as only a few of the potential M&A
targets satisfy this criterion.
which can be quite large and, thus, possibly include the
fallback price that the stock settles to in case of the deal’s failure.
Finally, this approach requires Target Company to have option with matching
maturities and strike price that are sufficiently liquid. This limits the
practical application of the method, as only a few of the potential M&A
targets satisfy this criterion.
Data Selection
risk neutral samuelson Rosenthal
This work studies cash acquisitions with the announcement date falling in the period from January 2010 to December 2013. The sample is restricted to cash only takeovers in order to eliminate additional influence on the target's stock price. All of the deal data e.g. companies’ names, effective dates and offer prices were taken from Dealogic. OptionMetrics database was used to choose suitable options (i.e. options with needed maturities and strikes). Then option data e.g. prices, strikes and maturity dates were downloaded from Bloomberg. Stock prices used to access “naïve” probabilities and excess returns were also taken from Bloomberg.the above-mentioned time period Dealogic reports 19 743 corporate takeover offers where the type of payment exclusively cash. Competing offers, pending deals and partial acquisitions i.e. those with an offer for less than 80% of the outstanding shares were excluded. Sample size dropped to 2 179 deals. Then sample was further restricted to only include target companies with market value of equity higher than $ 1 bln, as they are more likely to have options traded. Deal duration (number of days until the offer either succeeded or failed) was insured to be more than 30 days in order to build in dynamics in risk-neutral probabilities estimation. The resulting sample consists of 306 deals. Significant sample size reduction shows that most of the companies acquired are relatively small and are less likely to have options traded on their stock. the criterion of OptionMetrics to have data on options traded for the target company and further insuring that there are options with fitting maturities and strike prices the sample of 164 deals was obtained that was then further used for analysis. Out of 164 deal offers 126 succeeded while 38 failed to reach agreement. Most of the target companies (approximately 97%) are U.S. companies which is not surprising due to United States having the most developed derivatives market. Median deal duration is 94 days; average duration-128 days and the longest deal took 636 days. Table 1 reports percentiles for deal durations. Table 2 a), b) summarizes information on 5 successful and 5 unsuccessful deals from the sample for which target companies are largest in market size. Price before the announcement was estimated to be a 5-day average 2 weeks prior to the announcement.
1. Percentiles for deal durations
|
Percentile |
5% |
25% |
50% |
75% |
95% |
|
Deal Duration |
35 |
54 |
94 |
161 |
366 |
2 a). Information on 5 largest deals.
|
Target Company |
Target Ticker |
Acquirer Company |
Target Equity Value, mln $ |
|
Anadarko Petroleum Corp |
APC |
BHP Billiton Ltd |
44 603 |
|
Alcoa Inc. |
AA |
Rio Tinto plc. |
27 329 |
|
Dell Inc. |
DELL |
Silver Lake Management LLC (MBO) |
21 073 |
|
HJ Heinz Co |
HNZ |
Berkshire Hathaway Inc.; 3G Capital Inc. |
23 576 |
|
Genzyme Corp |
GENZ |
Takeda Pharmaceutical Co Ltd |
21 237 |
|
Goodrich Corp |
GR |
United Technologies Corp |
16 513 |
|
Whole Foods Market Inc. |
WFM |
Kohlberg Kravis Roberts & Co and Bain Capital |
15 947 |
|
Life Technologies Corp |
LIFE |
Thermo Fisher Scientific Inc. |
13 641 |
|
Sara Lee Corp |
SLE |
JBS SA; Blackstone Group LP |
13 425 |
|
Motorola Mobility Holdings Inc. |
MMI |
Google Inc. |
12 938 |
Table 2 b). Information on 5 largest deals.
|
Target Ticker |
Announcement date |
Resolution date |
Offer price, $per share |
Target price before announcement, $ per share |
Target Price, Completion Date, $ per share |
Offer premium, $ per share |
|
|
|
|
Success |
Failure |
|
|
|
|
|
APC |
30.12.10 |
|
15.03.12 |
90 |
68,5 |
|
31,4% |
|
AA |
03.05.11 |
|
11.09.12 |
25,5 |
16,438 |
|
55,1% |
|
DELL |
05.02.13 |
29.10.13 |
|
13,88 |
12,8 |
13,86 |
8,7% |
|
HNZ |
14.02.13 |
07.06.13 |
|
72,5 |
60,7 |
72,49 |
19,5% |
|
GENZ |
14.11.10 |
|
14.03.12 |
82 |
72,18 |
|
13,6% |
|
GR |
21.09.11 |
26.07.12 |
|
127,5 |
86,76 |
127,48 |
47,0% |
|
WFM |
18.08.11 |
|
18.08.12 |
90 |
31,2746 |
|
187,8% |
|
LIFE |
15.04.13 |
03.02.14 |
|
76,13 |
71,11 |
76,04 |
7,1% |
|
SLE |
18.12.10 |
|
14.03.12 |
21 |
17,43 |
|
20,5% |
|
MMI |
15.08.11 |
22.05.12 |
|
40 |
38,13 |
39,98 |
4,9% |
our sample of 164 cash tender offers with options traded on
the target company. As we observe in Table 1, the length of the offer period
varied significantly for the chosen sample. Thus, for the sake of comparability
we consider two intervals for which risk-neutral probability forecasts will be
analysed: 3 weeks after the announcement date and 3 weeks prior to deal’s
resolution. For each target company a daily time-series of option bid and ask
prices and stock prices were constructed for post-announcement days d=1, 2, …,
15 and pre-resolution days d=-15, -14, …, -1. Then, daily risk-neutral
probability forecasts were calculated using equation 10) for the
above-mentioned time period. Risk-free rate was estimated as 90 days T-bill
rate. first difference approximation of risk-neutral CDF doesn’t insure that
probabilities lie within the interval [0,1] the following procedure was
followed: for probabilities that satisfied the [0,1] condition midpoint option
price was used in calculations, for those outside the desired range - some
weighted average of bid and ask price that would insure convexity of option
price with respect to strike price. Weights assigned to bid and ask were
conditioned to be lower than 1 to insure that chosen option price lies within
bid-ask spread. Furthermore, to insure no arbitrage option prices were checked
to satisfy the following bound:

analyse the forecasting performance of success probabilities
derived from option prices Murphy’s Partition of the Brier score was used - a
widely employed measure in probabilistic forecasting. For this purpose daily
probability estimates were averaged to weekly and grouped in discrete
categories and then observed success rate for each category was calculated. For
binary events Brier score represents the standardized measure of forecasts’
mean-square error and is defined as:
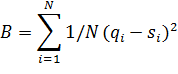
N-number of forecasts,  - predicted probability of success
for i-th observation,
- predicted probability of success
for i-th observation,  -actual outcome (1 if offer succeded, 0 if failed). Lower
Brier score corresponds to more accurate forecasts. Murhpy's partition
decomposes the original Brier score into 3 components: Uncertainty (or Base
rate), Calibration and Resolution. The partition can be represented as:
-actual outcome (1 if offer succeded, 0 if failed). Lower
Brier score corresponds to more accurate forecasts. Murhpy's partition
decomposes the original Brier score into 3 components: Uncertainty (or Base
rate), Calibration and Resolution. The partition can be represented as:
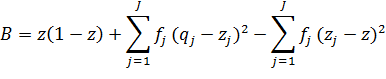
z is the success frequency for the whole sample,  - frequency of forecasts falling to
probability category j,
- frequency of forecasts falling to
probability category j,  - forecasted success frequency for category j (for example
for the category that aggregates probability estimates from 0,2 to 0,3 would be 0,25),
- forecasted success frequency for category j (for example
for the category that aggregates probability estimates from 0,2 to 0,3 would be 0,25),  - actual success frequency for
category j. The first term, or uncertainty component, is in fact, independent
of the probability forecasts and simply depends on the overall probability of
success. Second term measure the calibration of the forecasts, i.e. how close
the probability estimates are to the ex post observed success frequencies.
Perfectly unbiased forecasts would always generate
- actual success frequency for
category j. The first term, or uncertainty component, is in fact, independent
of the probability forecasts and simply depends on the overall probability of
success. Second term measure the calibration of the forecasts, i.e. how close
the probability estimates are to the ex post observed success frequencies.
Perfectly unbiased forecasts would always generate  and, thus, imply calibration
component equal to 0. Therefore, a reduction in calibration component, holding
other things constant, would improve the Brier score. Third term represents the
forecasts' resolution or, in other words, by how much the conditional
probabilities given the different forecasts deviate from the sample average.
The higher the resolution component, the lower the Brier score. However, there
is usually a trade off between calibration and resolution components. In
general, Brier score encourages forecast discrimination as long as calibration
is not offset too significantly.proceed with estimating «naive» probabilities
derived from stock prices and testing the hypothesis whether option-implied
probabilities outperform them in terms of forecasting quality. Samuelson and
Rosenthal (1986) evaluated the probability of a tender offer's as:
and, thus, imply calibration
component equal to 0. Therefore, a reduction in calibration component, holding
other things constant, would improve the Brier score. Third term represents the
forecasts' resolution or, in other words, by how much the conditional
probabilities given the different forecasts deviate from the sample average.
The higher the resolution component, the lower the Brier score. However, there
is usually a trade off between calibration and resolution components. In
general, Brier score encourages forecast discrimination as long as calibration
is not offset too significantly.proceed with estimating «naive» probabilities
derived from stock prices and testing the hypothesis whether option-implied
probabilities outperform them in terms of forecasting quality. Samuelson and
Rosenthal (1986) evaluated the probability of a tender offer's as:
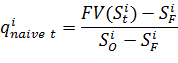
 -price of the stock at time t,
  -fallback price,
  -offer price per share,
  - future value of the stock price at
the resolution date that was defined as
- future value of the stock price at
the resolution date that was defined as 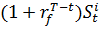 and
and  is defined as risk-free rate of
return for the period starting from time t to the resolution date T.price was
estimated based a sample of failed deals using OLS regression with restricted
coefficients. The proposition was that fallback price can be modelled as a
weighted average of the stock price before the announcement and the offer bid:
is defined as risk-free rate of
return for the period starting from time t to the resolution date T.price was
estimated based a sample of failed deals using OLS regression with restricted
coefficients. The proposition was that fallback price can be modelled as a
weighted average of the stock price before the announcement and the offer bid: