Материал: chapter II
2.3 Image transform in reproduction
The transform of original into some intermediate copy (transparency, plate, proof) or a resulting print includes three following basic stages:
analysis which results in producing the image signal;
this signal (nowadays mostly the digital numerical data) functional transforms;
synthesis as the reverse move from signal to the image on a print, display, plate, proof or, at last, in mind of a viewer.
2.3.1 Electro-optical analysis
At this first stage the tone values of picture elements with their spatial coordinates x and y are turned into amplitude of an electric signal at the output of photoelectric transducer (PET) in function of the time or sampling rate in the line-by-line or element-by-element scanning. These amplitudes depend on the light coming onto PET from a unit original area equal in its size to the sampling element - scanning aperture. If tone value stands for the analogue of amperage, voltage, frequency or other parameter of electric current the image is considered to be “analogous”. Staying in essence analogous the image capturing devices of today are fit at their output with Analogue to Digital Converter (ADC) to turn such signal in form of a binary code, i.e. to make it “digital”.
In context of the various kinds of an image processing this stage can be named as input, image capturing, scanning, light to signal transform, etc.
2.3.2 Image signal transforms
In absence of scanning and photoelectric transform like in a photo taking at light sensitive film by a camera, the functional image data transforms are of the full format (over a whole picture area) and “global” (over a whole brightness range, spatial and color spectra). Changing the gradation, for example, in highlights and dark areas without effect on middle tones is just possible by the time consuming and costly preparation of an auxiliary images (gradation masks).
Selective correction is, to the contrary, easily performed in electronic reproduction by choice of the certain amplitude transfer function in the control circuit. There is also possible to provide the correction in desired bands of color spectra. All these advantages have made obsolete the camera based prepress technology after the middle of the last century.
Essentially new facilities have appeared in the computer aided reproduction. Tone value of an each pixel is presented here by the binary code while the whole image by such codes matrix allowing for distracting from the scan time and performing the all transforms as operations with a numerical data. It becomes available to make desired correction in any local picture area and, as especially important, to combine (layout) text and illustration on a page as well as to assemble (paginate) the larger press sheets. Digital image presentation had allowed for bringing the significant part of prepress operations out print house or repro center. They are used to be performed today on the base of desktop by publishers, customers, authors…
In relation to their effect on an image the functional transforms can be divided onto four distinctive groups:
low spatial frequencies;
high spatial frequencies;
format;
structural.
The first kind of these actions is concerned, first of all, of larger details tone and color as far as the ability of vision to their discerning is great though sharply diminishes with their dimensions reduce. In analogous electronic reproduction there was used to influence for this purpose on the amplitude of an image signal and therefore such transforms were sometimes mentioned as amplitude ones.
Second group of transforms influences on the sharpness and definition by strengthen the higher image spatial frequencies. Among these procedures are the aperture correction, unsharp masking fixing the distortion caused by spatial frequencies low pass filtration at scanning, sampling, screening stages and thereby somehow compensating the loss of image contours and fine details contrast and geometric accuracy. Such parameters processing is referred in photography to Modulation Transfer Functions (MTF) of sensitive layers, lenses and the like, as far as in electronic systems to that of separate electric circuits or a whole imaging channel.
Format transformations are concerned of the image sizing, rotation and cropping. The latter is used to cut out the particular piece of original to be placed on a page according the editorial intent. It’s also used for minor correction the dimension of graphic elements inserted in each other in different color print runs. This trapping procedure provides their slight overlap to exclude the noticeable gap there between due to the paper sheet mis-register.
At final prepress stage the especially important role belongs to the already mentioned transform of continuous tone structure of an original to the halftone one – screening. Its characteristics essentially influence the most of print copy quality parameters in relation of tone and color rendition, definition, sharpness, presence of aliasing (moiré), geometric accuracy of fine details and contours…
2.3.3 Image synthesis
In television and computer display the image synthesis comprises, contrary to electro-optical analysis, the reverse transition from electric signal to the light emitted by a TV screen or monitor. However, in graphic technologies the signal-to-light transform isn’t the only way to produce a copy. In electro-mechanical engraving, for example, the video signal controls a depth of stylus immersion into material of a plate. In context of various image processing tasks this, by its sense the same process, can be defined by such terms as output, printing, recording, exposing, engraving, receiving, display, visualizing…
2.3.4 Complete and hybrid reproduction systems
Three described above stages of image analysis, signal processing and synthesis characterize, in general, the so called complete reproduction system. Among the vast variety of such systems there is the traditional photography. Exposure of a film by the brightness of an object or scene corresponds to the image input or capturing. Interaction of a latent pictorial relief with color sensitive layers can be related to the optical signal processing while the film chemical development to the synthesis of a copy.
Viewing of the resulting picture is also considered as the complete, three stage process. Image analysis is in this case mostly physiological, stipulated by chemical reactions in sensitive receptors (cones and rods) of the eye. They excite the ends of brain nerves transporting visual stimulus to the mind for further cognitive processing which results in appearance of the “mental” image in the viewer’s mind. Such image doesn’t comprise the colorimetric match of a viewed copy because of the cognitive aspect, relating to the observers’ visual memory, experiences, expectations, preferences…, being greatly used in its formation. By this reason it occurs rather difficult to estimate the image quality in absence of source visual object or scene as the basis of comparison.
It follows from above that the whole of such object transform into an image appeared in the viewer mind should be considered in context of some hybrid reproduction system comprised of the several three stages complete ones. At the initial step there can be, for example, the photographic process to make an original copy. Such way produced slide would be further used in the other complete system including a scanner, computer, printer or monitor. The following viewing of resulting copy includes the three similar stages.
Picture properties
Among the multiple image parameters there will be useful to concern, for beginning, their certain minimum acceptable for the following disclosure. It’s proper to probationary divide them onto local ones, as characterizing the given point of an image, i.e. the pixel thereof and “global” as related to image in common.
2.4.1 Local parameters
Image mostly comprises the replica of a visually perceived three dimensional and polychrome surround world. Each element of a visual object can be characterized by six parameters: spatial coordinates (x, y, z); brightness (B); hue (λ); chroma (p). Five of them (x, y, B, λ, p) correspond to two dimensional (flat) picture, while just three (x, y, B) - to the black and white (b/w) one.
Brightness describes the light intensity coming from the given point of an object to the visual system which, in its turn, produces the feeling valued in colorimetry by lightness, i.e. by the kind of a subjective, relative measure for brightness perception. The same brightness can quite differently appear for observer depending on several collateral factors. Among them there are the intensity (Figure 2.2) and time of adaptation to brightness of an object background and some others.
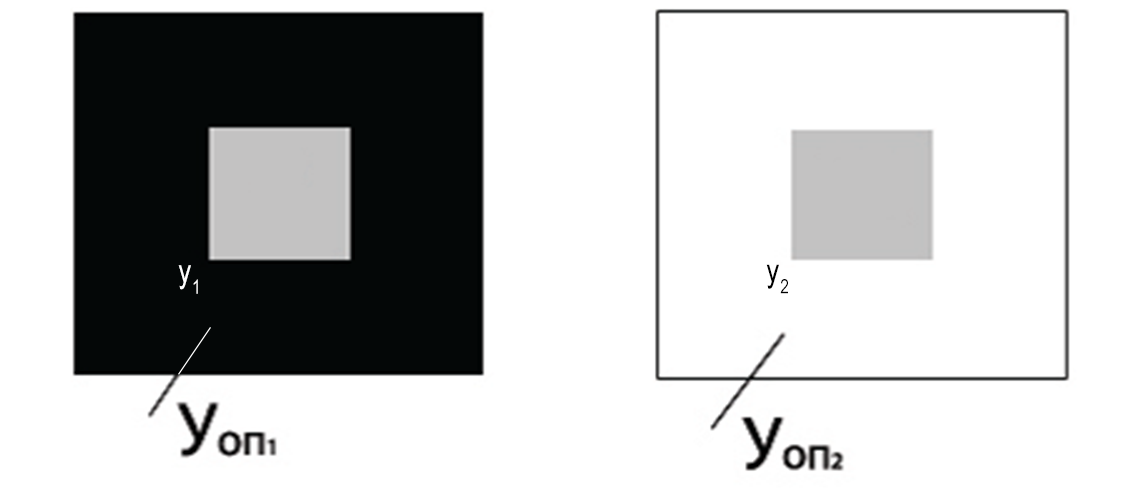
Figure 2.2. Grey spot of the same brightness (Y1 = Y2) looks darker on light background of YREF2 than on a dark one of YREF1 being different in its lightness (L1 › L2)
For example, being not activated by a signal, the area of a turned on monitor screen may look black in presence of the adjacent white. Same area, as well as the whole screen appear, however, lighter on a turned off monitor in spite of being in the same non activated physical state, i.e. having the same intensity. Due to relative nature of visual perception the flower looks white both in the garden and indoors. Its brightness becomes in the house thousand times lower but there are no other, whiter objects in the field of viewing. That’s why the equation, adopted by the International Commission on Illumination (Commission Internationale de l’Eclairage – CIE), along with the brightness component Y of originate color system CIE XYZ, includes the brightness YREF of a reference white, which lightness L comprises 100 units according the equation [2.5]:
 2.1
2.1
Brightness can be assumed for the quantitative issue of color with a chromaticity addressed to its “quality” and jointly described by such attributes as hue, chroma, saturation. Meaning of hue is simply defined by the length of electromagnetic wave in visible spectra (380-720 nm) and, that’s why, can’t, contrary to other of these parameters, be “greater”, “fewer” or become a null, i.e. measured in relation to a certain reference value. From the other hand, the lighter sides of a uniformly painted cube, i.e. having the same hue, look more colorful than less illuminated ones because of the greater chroma which is estimated in relation of their brightness. In spite of being differently illuminated, all these sides are characterized by the same saturation value. The latter is measured in relation to their brightness and can vary in color just according to the relationship of its chromatic and achromatic components. For a sample of given hue and brightness the terms chroma and saturation are equivalent.
In terms of photometry the brightness is measured non relative to form of a spectra by integral power irradiated in a unit spatial angle from a unit object area. Visual brightness is normalized according the luminous efficiency function – eye spectral sensitivity curve given in figure 2.3.
|
|
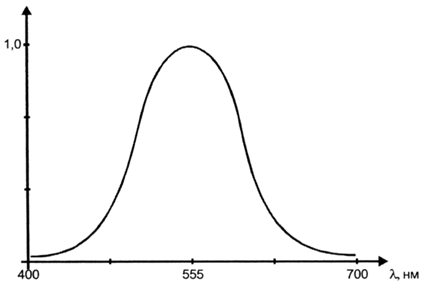
Figure 2.3 Luminous efficiency function used for transition of photometric units in visual ones– eye spectral sensitivity curve.
It demonstrates the great HVS response variation to light intensity at different wavelength with maximum for green in the middle.
Visual brightness is quite useful for non ambiguous characterizing of self luminous objects such as TV screens but can’t, however, match the original copies and prints evaluation. They are perceived in transmitted or reflected illumination and the brightness of their elements depends not only on the image properties themselves but on the incident light intensity. With no relation to illumination the elements of reflection copies are characterized by their reflectance coefficients ρху and for positive and negative transparencies - by transmittance factors τху.
Meanwhile the straightforward use of such parameters, similarly to brightness, isn’t comfortable because they don’t correlate to visual perception. Stepwise tone wedge in figure 2.4 (a) with its patches differences in equal reflectance (Δρ = ρк+1 - ρк = const) doesn’t look uniform. It happens due to Veber – Fehner - Stivens low which postulates that in rather wide range of brightness, as irritating stimulus, the perception (lightness) is proportional to its relative but not absolute value.
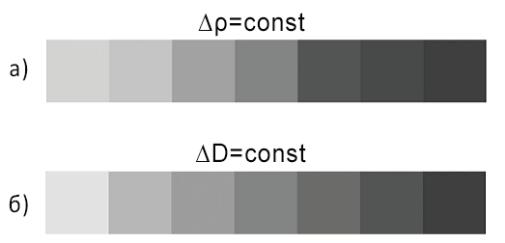
Figure 2.4 Non uniform (Δρ = ρк+1 - ρк = const) and more uniform (ΔD = Dк+1 - D к = const) stepwise tone wedges
By this reason the other, for example, logarithmic values are used to estimate the perceptions arising as result of the coercions on human physiological feelings. All of these values are provided by essentially non linear transforms of the kind of 2.1 and 2.2. That’s why the step wedge in figure 2.4 (b) looks, for example, more uniform as far as its patches differ from each other on the same discrete of an optical density
|
2.2
|
 ,
,i.e. negative decimal logarithm of reflectance (transmittance) factor, so satisfying the condition: ΔD = D к+1 - D к = const.
Optical density comprises 0; 1; 2; 3…, if there is reflected (transmitted) the all incident light, its 1/10; 1/100; 1/1000… part. There are regular, diffuse and other modifications of density used in photometry. They somehow differ of each other depending on the share of luminous flood reflected from or transmitted through a sample and captured by the instrument’s sensor [2.6].
So, it’s, as a result, used to explore, in context of various tasks, the number of parameters with different properties for describing the picture element even of a b/w hardcopy. Table 2.2 is given below to show such two properties relationship between the brightness, lightness, reflectance and optical density.
Table 2.2 Properties of hard copy element parameters
|
Does unambiguously describe? |
Is conformed to the perception? |
Brightness, Y |
no |
no |
Lightness, L = 116 (Y/Yref)1/3 –16 |
no |
yes |
Reflection factor, ρ |
yes |
no |
Optical density, D = – lg ρ |
yes |
yes |
Number of such parameters becomes even greater for color image with taking into account the addition of hue, chroma, saturation… Their standard definitions can be found in the multilingual CIE vocabulary [2.5].