Материал: chapter II
Common properties
The ranges of optical densities both of an original copy and resulting print:
 2.3
2.3
are
important for the reproduction setting.
The
relationship of brightness values on an image is also characterized
by the contrast
– ratio of reflectance factors. Lightness of a detail depends on
the brightness of an adjacent field or on that average or ultimate
for an image. That’s why along with the common
contrast defined as
 2.4
2.4
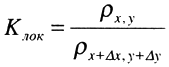
there are met its such interpretations as local contrast
|
2.5 |
or detail contrast:
|
2.6 |

when the reflectance of a pixel ρх, у or detail ρдет is divided on reflectance ρx+Δх, y+Δу of a proximal field or on a minimal, for all the image, value ρmin.
According to (2.2 and 2.4) the density range comprises:
Δ D = lg K 2.7
All of these formal quantitative parameters don’t however sufficient for non ambiguous judgment of the so called apparent contrast as an impression arising at the image viewing. It’s known, for example, that the copy looks of higher contrast and colorfulness when such of its parameters as described below sharpness increases. Print of given formal contrast K and density range Δ D can, beside of that, look shiny or dull depending on its tonal content. The pixels with levels near extreme ones ρmax or ρmin will dominate for the first case in the computer program histogram of tone levels distribution over an image. For the second case, some intermediate tone values will alternatively prevail in spite of a presence in a picture of some small spots of ultimate brightness. This means that the described later procedures of tonal correction allow for apparent contrast changes by gradation redistribution within a density range with no effect on ultimate tone values, i.e. on a formal image contrast.
Print definition relates to dimensions of fine details and geometric accuracy of contours presented on a copy. In television this parameter is directly estimated by the number of sampled pixels, i.e. by the amount of minimal black and white details which can be placed in the frame in a chess board order [2.1]. In such interpretation it comprises
 ,
2.8
,
2.8
where k is the frame format index, z – number of strokes for the given TV standard and assumed that the size of a pixel is the same in both scan directions. With k = 4/3 and z = 625 the definition of b/w TV picture comprises about half million elements.
Being the informative parameter it also defines, for example, the size of a memory required for non compressed frame data:
|
2.9 |
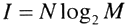 ,
,where M is the number of a light parameter possible levels for each element.
Signal volume increases with the growth of number of samples and their quantization levels. In digital TV and reproduction the latter typically comprises 256 and, as far as such number encoding needs eight digits, the data volume of a TV frame comprises N bytes. It does not depend on size of a screen, while for the print copy this volume is, to the contrary, depended on the picture area and can be measured as
Nprint = a b L2, 2.10
where a and b are the horizontal and vertical image dimensions, while L is the screen ruling as an amount of halftone dots per its unit length. This way estimation for a monochrome A3 (12 x 16 inches) print of 150 Lpi gives the ten times greater, than for TV frame, definition of 4.3 million elements and data volume of about 4.3 Mbytes. Such fact points out the rightfulness of “graphic quality” term use underlining the higher, as compared to other imaging means, information capacity of print copies. Such informative nature of print image definition parameter is once again confirmed by the paying “per square inch” area of advertising in periodicals.
With definition related to the minimal size of a reproduced detail the edge quality of the latter is, not depending on its dimensions, characterized by sharpness. There is, however, the correlation of these parameters: the image of higher definition looks more acute.
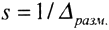
The sharpness of photographs is stipulated by resolution of lenses, emulsions, CCD matrixes, light scattering in optical components, etc. It’s measured by the inverse value of an edge fringe width (Figure 2.5) as:
|
2.11 |
 (1/mm)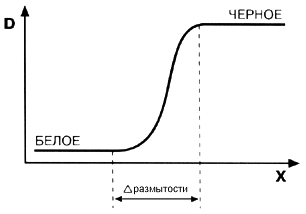
Figure 2.5. Density distribution on the sharp black to white transition in a real image.
Greater fidelity of sharpness estimation is provided with the use of equations accounting the form of density dispersion or its gradient within a fringe which variation is indicated by a couple of dotted curves in figure 2.5. For images produced with the use of scanning by a finite size aperture, such as in TV or digital photography, this parameter can be also estimated by the relative value of a scan spot and fringe width ratio as:
|
2.12 |
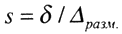 ,
,It presumes that the sharpness is first of all limited in these applications by the size of scan spot or input sample. Such measure can be expanded for the halftone prints with taking for a unit area the screen mesh.
Image and imaging system parameters correlation
As far as above mentioned parameters characterize the image itself they are sometimes referred as the, so called, first order parameters while to the second order ones are related the properties of a technical system, process or device providing the corresponding first order parameter as a factor of image quality [2.7].
In this concept the brightness and reflection of an original correlate to the amplitude of a signal at photo sensor output in analogue scanner or to the number of its quantization levels in digital reproduction. The optical density and lightness are corresponded to said signal after its non linear transform.
Optical density range and image contrast are defined by the signal dynamic range or bit depth used in encoding. Print definition and sharpness are correspondingly related to resolution and step response of a system while the copy tonal content is defined by the Tone Reproduction Curve (TRC) of a signal amplitude transformer.
Such differentiation assists in adequate use of terminology. Resolution or TRC don’t, for example, sound correct when applied to the image itself instead of some imaging system, its component or process. In this context the direct characterizing the image quality by parameters of test wedges and patterns of printing process control may also look confusing.
Picture quality control
Evaluation of an image data, means and reproduction results
There are variety of measuring devices in use for objective evaluation the parameters of originals, intermediate images and final prints. They are available in portative implementation comfortable for the use in production environment. Their indications are calibrated in units adopted for the graphic industry and, as well, are computer compatible allowing for the direct input of, for example, the ink spectral parameters in technologic data bases of print quality control.
Along with the optical densities the digital densitometer can show the multiple of the other useful for control data: print element area, optical and physical dot gain, print contrast, ink trap…as well as the data showing the spectral purity of process inks. High resolution slide scanner can with the microscopic accuracy provide the dot density profiles of a halftone transparency. Color coordinates and differences are measured by colorimeters for various CIE metrics according to target viewing conditions.
Electronic reproduction and desktop publishing applications operate the similar parameters for the optically captured originals after their proper interpretation by the special hardware or program.
The identity of measurement techniques and metrics in different print production locations to those used in creating and processing the original copy in photography, computer graphics and prepress is also important.
Visual comparison and subjective quality evaluation of color copies is provided in normalized viewing conditions in the light booths equipped by several standard sources of illumination. To assure the truthfulness of checking the reflection originals, color proofs, OK sheets and pressrun prints are supplied by the metamer labels – color of light indicators.
Various graphic test elements are widely used for the control of above mentioned second order parameters of reproduction process and equipment. Patterns and textures of different frequency, orientation, geometry and contrast are useful for resolution estimation. Reproduction of multistep tone wedge can illustrate the TRC and system response to the smallest steps of an input gradation. Continuous tone degrade tint, vignette demonstrates the smoothness of tone and color rendition as well as detects the false pattern (moiré) appearance.
Tests with the standard realistic images, patterns and wedges placed over a whole press sheet are used for the general adjustment of a printing process and equipment while in production runs the smaller ones are located in per ferial sheet area.
The number of important parameters is directly controlled by such instruments like ruler, lens, microscope…
Parameters conformity and standardization
In informative and aesthetic relation the printed image is mostly addressed to psychovisual perception of a viewer. It’s until now to the certain degree produced with the use of intuitive, empirical approaches and subjective judgments. Inborn or acquired artistic skills were for a long time considered for the sign of professional fitness to printers’ gild. Such issues had become less critical just in the last century due to appear of the objective, quantitative estimation for properties of raw materials, intermediate and final results of printing as well as with the development of a normative base and standardization.
Creative component of color illustrating had, as result, completely shifted from the print house to the author, editorial, design, publisher… stages. In some cases, for example, with the use of “digital” press the printer being earlier the key figure of a process gets the position of an operator of some automated complex. Printing stage completely lost the function of illustration properties control and readdressed it to the prepress image file preparation. That makes the tasks of this stage normalization and standardization especially actual in relation to the halftone image generation specific. However, the criteria of printing process optimization aren’t completely investigated because of the necessity to take into account the vast variety of factors.
Electronic mass media can’t exist without the robust standardization of signal parameters, file formats or of a pickup camera and display properties. Color printing is, to the contrary, more or less successfully provided for a multiple process inks combinations, kinds of substrates, printing methods, machines… This significantly sophisticates the standardization in graphic technology in relation for, as example, non ambiguous reproduction of color.
Radical changes of the late had shifted the accents in scientific descriptions and research tasks actuality. Not so far ago were the times when the number of scientifically approved proposals on print quality improvement couldn’t be realized due to the lack of means to control the ink amount thereon. Modern computerized prepress is able to operate it with the discreteness, which corresponds to 25 – 100 square microns of an ink layer area, thus making, to the contrary, actual the question of direction and degree of said amount changing to achieve the best result.
Along with the normalization and stability providing, this fact makes also actual the methods of finding the optimal process settings. They should to take into account the specifics of originals, plate making and printing stages as well as the mentioned control facilities of prepress. Finding of the optimal regime, as will be shown lower, is often performed in compromise conditions of the contradictory satisfying the quality properties having, in spite of their equal importance, rather different nature and metric.
Standardization became especially demanded with the transition from “closed” to “open” electronic publishing of 1990ies. All the prepress operations, including the halftone transparencies output, were earlier performed in a single process inside the print house or repro centre and therefore were focused on more or less familiar properties of all stages. It was also possible to specify settings and functional transformation parameters from job to job as well as to periodically provide the total, through (input – output) calibration (fingerprinting) for the whole process or its separate operations. There was used, for example, to directly confront in look-up table the color values provided by given press and the input signals of a scanner.
At coming to PC or Mac based, open prepress environment there were acutely aroused the questions of color values non ambiguous interpretation by various software applications, computer platforms and per ferial devices (scanners, monitors, proofers, printers…). However, all the efforts International Color Consortium (ICC) on creating the norms, measuring and software means of Color Management Systems (CMS) through Color Connecting Spaces (CCS) wouldn’t be effective without the strictly talked over characteristics of material part of technology embracing the plate making and printing stages as well as the materials and equipment used therein.