Материал: Russian Journal of Building Construction and Architecture
Russian Journal of Building Construction and Architecture
For optimal penalty distribution the cooperative game theory is considered where the goal is to optimally distribute the prizes between the winning players having different kinds of agreements among them. The cooperative game theory entails the concept of a project task that occurs when there is a difference between an actual and planned timeline of a construction project [2].
The maximum penalty for delays equals the time of delay. A project task in this case can be described using the following three: ({N1,…, Nm}, p, r).
Let us assume that the function max{p, r} is an actual timeline following the completion of a construction project. Then D(max{p, r}) − D(p) specifies a maximum penalty for all the delays. In [12, 19] we looked at how relevant this model is. It is suggested that according to [1, 2], the vector b is defined as
bi maxmin{d(i),(D(N ,max{p,r}) D(p)) } i N, |
(1) |
:N i |
|
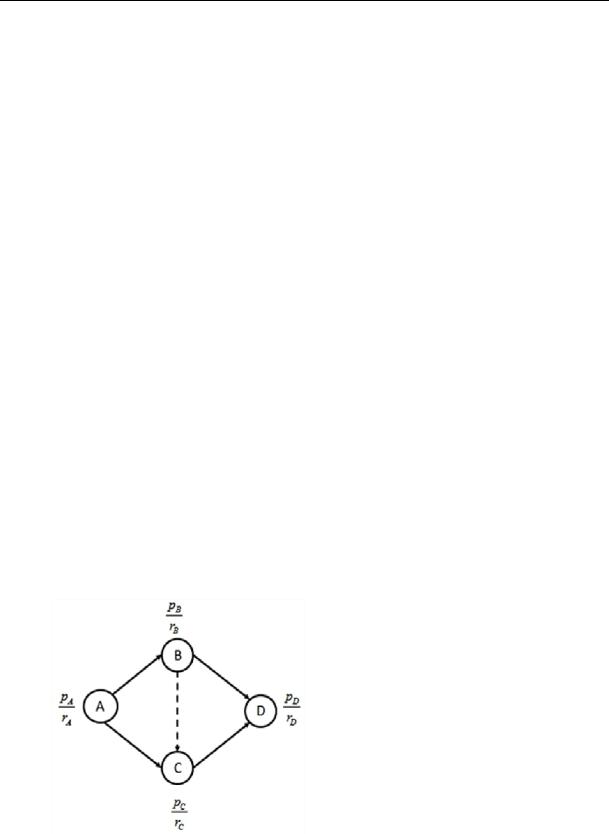
where N is the amount of work involved in a construction project; i is project work; p is a planned timeline of work; r is an actual timeline of the project; d(i) is a delay in the completion of the project; D(p) is a planned timeline of a construction project; Nτ is a life cycle of a project. Let us look at an example of a graph of a construction project (Fig.1) where the planned time
p : N is defined as p(A) |
2, |
p(B) 3, p(C) |
15 and |
p(D) |
13, the actual |
timer :N is defined as r(A) |
|
9, r(B) 5, r(C) |
11 and |
r(D) |
12. Then the |
project task can be presented as({N1,N2,N3,N4}, p,r). |
|
|
|
||
Fig. 1. View of a graph of a construction project
According to the suggested approach [7, 8] for identifying the optimal penalty we get the values from Table 1.
70
Issue № 1 (41), 2019 |
ISSN 2542-0526 |
Таble 1
Values for identifying the optimal penalty
N |
D(N , p) |
D(N ,r) |
D(N ,max{p,r}) |
D(N ,min{p,r}) |
|
|
|
|
|
AC |
17 |
20 |
24 |
13 |
|
|
|
|
|
AD |
15 |
21 |
22 |
14 |
|
|
|
|
|
BC |
18 |
16 |
20 |
14 |
|
|
|
|
|
BD |
16 |
17 |
18 |
15 |
|
|
|
|
|
According to Table 1 D (p) =18 and D (r) =21. In this case a delay in a construction project is 3 units. Then according to (1) we get:
b1 max{min{d(A),(D({A,C},max{p,r}) D(p)) }, min{d (A),(D({A,D},max{p,r}) D(p)) }}
max{min{7,(24 18) },min{7,(22 18) }}
max{min{7,6},min{7,4}} max{6,4} 6,
b2 max{min{d(B),(D({B,C},max{p,r}) D(p)) }, min{d(B),(D({B,D},max{p,r}) D(p)) }}
max{min{2,(20 18) },min{2,(18 18) }}
max{min{2,2},min{2,0}} max{2,0} 2,
b3 b4 0.
Emin{D(p) D(min{p,r}),D(max{p,r}) D(r)}
min{18 15,24 21} min{3,3} 3.
We get that С(α) = 3α+3 is a joint financial penalty for the work A and B and also cC( ),b ({A}) min{3 3,6} 3 3,
cC( ),b ({B}) min{3 3,2} 2.
Then for each work and agreement between them we have the function cC( ),b (Table 2).
|
|
|
|
|
|
|
Таble 2 |
|
|
Values for identifying the optimal penalty |
|
|
|||
|
|
|
|
|
|
|
|
S |
cC ( ),b (S ) |
{D} |
0 |
{B, C} |
2 |
{A, B, D} |
3α+3 |
{A} |
3α+3 |
{A, B} |
3α+3 |
{B, D} |
2 |
{A, C, D} |
3α+3 |
|
|
|
|
|
|
|
|
{B} |
2 |
{A, C} |
3α+3 |
{C, D} |
0 |
{B, C, D} |
2 |
|
|
|
|
|
|
|
|
{C} |
0 |
{A, D} |
3α+3 |
{A, B, C} |
3α+3 |
N |
3α+3 |
|
|
|
|
|
|
|
|
71
Russian Journal of Building Construction and Architecture
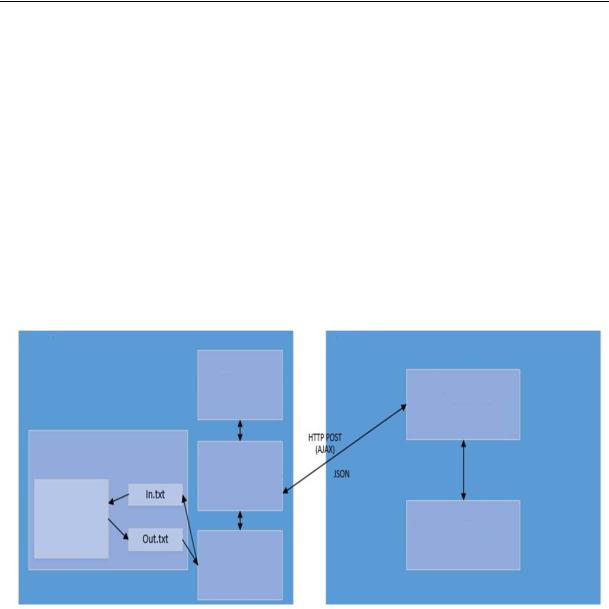
2. Implementation and description of the application. The application for designing a construction project graph and calculating the optimal distribution of delay penalties consists of the client and service components and operates in the following manner. An input text file with actual and planned timeline for the work is uploaded into the calculation module giving the main idea of how the application works and then it is converted into an output text file. Then this output text file containing the calculated penalties gets into the data model that is fundamental to the project graph [4—6]. Then the information from the data model gets into the implementation interface where the graph can be changed by the user. From the implementation interface the graph information is further drawn in the SVG-modulus.
The architecture of the application is presented in Fig. 2.
Browser |
|
Server |
|
SVG- |
|
|
representation |
Server compo- |
|
of the project |
nent of the Web- |
|
|
application |
|
|
(PHP) |
Virtual environment |
Implementa- |
|
for the calculation module |
|
|
tion of the |
|
|
|
|
|
|
interface |
|
Calculation |
(JavaScript) |
|
|
|
|
module |
|
File storage |
C++ |
|
|
|
of the projects |
|
|
|
|
|
Data model |
|
|
(JavaScript) |
|
Fig. 2. Architecture of the application
If the user wants to open one of the ongoing projects, save, cancel or renew the project, the interface implementation module interacts with the server component of the application via the AJAX-query. The server component of the application refers to the project file storage. Then the graph gets from the file storage into the server component of the application and using the AJAX-query is directed into the interface implementation module. The information from the interface implementation module is directed for drawing into the SVG-presentation module.
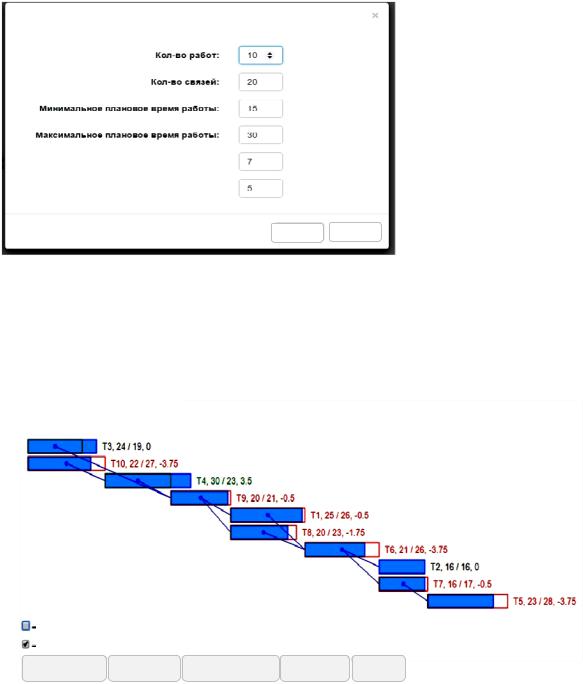
3. Implementation of the program interface. The user enters the initial information into a new construction project template (Fig. 3).
72
Issue № 1 (41), 2019 |
ISSN 2542-0526 |
New random project
|
|
|
Number of works |
|
|
|
|
|
|
|
|
|
|
|
Number of connections |
|
|
|
|
|
|
|
Fig. 3. Task of the initial data |
|
|
|
|
|
|
|
Minimum planned timeline |
|
|||
|
|
on the project |
|||
|
|
|
|
|
|
|
Maximum planned timeline |
||||
|
|
||||
|
|
|
|
|
|
Maximum time advances
Maximum time delay
Create Cancel
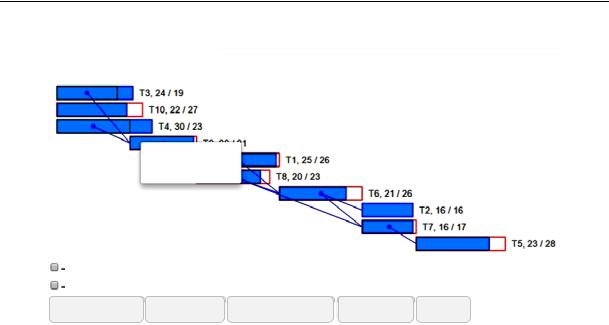
Then the graph of the project is generated where the works that had an impact on time delays and resulting penalties are in red and those executed ahead of time are marked in green (Fig. 4).
Calculation of the project
According to the timeline |
|
|
Automatic recalculation |
|
|
Random project Normalization JSON-representation |
Input file |
Calculation |
Fig. 4. Generation of the project graph
The user can also edit a construction project graph, i.e. add, cancel some of the components or connections between them (Fig. 5).
After the project graph has been edited, all of the values are recalculated and a new construction graph is designed. As well as the overall approach, this allows a wide range of taks including those facing the construction industry to be addressed. In this case modelling based on the game
73
Russian Journal of Building Construction and Architecture
theory can be considered unified.
Calculation of the project
Change the task
Cancel the task
According to the timeline
Automatic recalculation
Random project Normalization |
JSON-representation |
Input file |
Calculation |
Fig. 5. Editing a project graph
The work entails the optimization of the function depending on a few variables. In [7, 9, 10] we looked at the possibility of using the macroprogramming language for that in construction industry as well as the relevance of the issue. It was also shown that the solution of the problem as well as the design and construction and assembly simply involves minimization of the function of costs in the calculation variant [9, 10, 18].
Conclusions. The paper deals with a new approach for identifying the optimal distribution of penalties in the construction industry as well as construction and assembly and development of the application based on it. This application improves the communication between the customer and contractor, which contributes to the rational use of funds allocated for a construction project. The game theory can be suggested as a means of modeling this scenario.
The developed module allows the optimal distribution of penalties for works and contractors that lead to disruptions of a project to be calculated and its graph to be edited if necessary. The results obtained using the software can be instrumental in analyzing the results of further engineering calculations.
References
1. Gubko M. V., Novikov D. A. Teoriya igr v upravlenii organizatsionnymi sistemami [Game theory in the management of organizational systems], 2005. 196 p.
74