Материал: Russian Journal of Building Construction and Architecture

Issue № 1(33), 2017 |
|
|
|
|
ISSN 2542-0526 |
||
|
|
|
|
|
|
End of Table |
|
1 |
2 |
3 |
4 |
5 |
6 |
7 |
|
Wales – 22 ATUs |
20.7 |
1 |
5.0 (24 %) |
3.0 |
0.7 (25 %) |
144 |
|
11 ATUs |
|
South Wales |
5.0 |
|
0.7 |
140 |
|
Scotland –– 32 |
78.0 |
4 |
4.4 (6 %) |
5.3 |
0.5 (10 %) |
68 |
|
ATUs |
|||||||
|
|
|
|
|
|
||
1county: Fife–– |
1.3 |
1 |
0.5 (38 %) |
0.36 |
0.05 (13 %) |
272 |
|
1 ATU |
|||||||
|
|
|
|
|
|
||
1 ATU |
|
Fife |
0.5 |
|
0.05 |
100 |
|
GERMANY |
357.0 |
13 |
9.3 (2.6 %) |
81.2 |
no data |
227 |
|
North Rhine- |
|
|
|
|
|
|
|
Westphalia –– |
|
|
|
|
|
|
|
5 ATUs at the re- |
|
|
|
|
|
|
|
gional level: Düs- |
34.1 |
2 |
8 (23 %) |
17.5 |
5.0 (15 %) |
513 |
|
seldorf, Münster, |
|
|
|
|
|
|
|
Arnsberg, Co- |
|
|
|
|
|
|
|
logne, Detmold |
|
|
|
|
|
|
|
25 ATUs at the |
4.4 |
Rhine-Westphalia |
7.2 |
|
5.0 |
694 |
|
local level |
(Ruhr) |
|
|||||
|
|
|
|
|
|||
Saarland –– 6 |
|
|
|
|
|
|
|
ATUs at the local |
2.5 |
1 |
1.2 (50 %) |
1.0 |
0.7 (70 %) |
389 |
|
level |
|
|
|
|
|
|
|
6 ATUs at the |
|
Saar |
1.2 |
|
0.7 |
580 |
|
local level |
|
|
|||||
|
|
|
|
|
|
||
FRANCE |
547.0 |
2 |
0.5 (0 %) |
64.0 |
6 (9 %) |
116 |
|
1department: |
|
|
|
|
|
|
|
Alsace, |
|
|
|
|
|
|
|
Champagne- |
57.4 |
1 |
0.3 (0.5 %) |
5.5 |
2.3 (42 %) |
97 |
|
Ardenne, Lorraine |
|
|
|
|
|
|
|
––10 ATUs |
|
|
|
|
|
|
|
4 ATU |
23.5 |
Lorraine (part of |
0.3 |
3.3 |
2.3 |
140 |
|
the Saar region) |
|||||||
|
|
|
|
|
|
||
POLAND |
312.6 |
1 |
5.5 (2 %) |
37.9 |
4.8 (13 %) |
124 |
|
3 voivodeships: |
|
|
|
|
|
|
|
Silesia –– 36 |
|
|
|
|
|
|
|
ATUs, Lesser –– |
|
|
|
|
|
|
|
22 ATUs, |
36.9 |
1 |
5.5 (15 %) |
8.9 |
4.8 (54 %) |
392 |
|
|
|||||||
Opole –– 12 ATUs, including in total 70 ATUs at the local level
81

|
Russian journal of building construction and architecture |
|
|
||||
|
|
|
|
|
|
End of Table |
|
1 |
2 |
3 |
4 |
5 |
6 |
7 |
|
34 ATUs at the |
|
Górnośląskie or |
|
|
|
|
|
|
Ostrava-Karviná |
5.5 |
|
4.8 |
872 |
||
local level |
|
|
|||||
|
(Katowice) |
|
|
|
|
||
|
|
|
|
|
|
||
CZECH |
78.8 |
5 |
no data |
10.5 |
no data |
133 |
|
REPUBLIC |
|||||||
|
|
|
|
|
|
||
Moravskoslezský |
5.4 |
|
0.95 (18 %) |
1.2 |
0.5 (42 %) |
222 |
|
kraj –– 6 АТUs |
|
||||||
|
|
|
|
|
|
||
|
|
Górnośląskie or |
|
|
|
|
|
no data |
|
Ostrava-Karviná |
0.95 |
|
0.5 |
526 |
|
|
|
(Ostrava) |
|
|
|
|
|
UKRAINE |
576.6 |
2 |
50 (9 %) |
42.5 |
3.8 (9 %) |
73 |
|
|
|||||||
2 oblasts: Donetsk |
|
|
|
|
|
|
|
–– 18 ATUs, Lu- |
53.1 |
1 |
10 (19 %) |
6.4 |
2.6 (40 %) |
120 |
|
gansk ––18 ATUs |
|
|
|
|
|
|
|
no data |
|
Donbass |
10.0 |
|
2.6 |
260 |
|
|
(Western part) |
|
|||||
|
|
|
|
|
|
||
RUSSIA |
17125.1 |
27 |
about 2500 |
146.5 |
3.5 (2 %) |
8 |
|
(15 %) |
|||||||
|
|
|
|
|
|
||
Rostov region –– |
100.0 |
1 |
13 (13 %) |
4.2 |
0.6 (14 %) |
42 |
|
55 ATUs |
|||||||
|
|
|
|
|
|
||
8 ATUs |
|
Donbass |
13.0 |
|
0.6 |
46 |
|
|
(Eastern part) |
|
|||||
|
|
|
|
|
|
||
Kemerovo region |
95.5 |
2 |
26.7 (28 %) |
2.7 |
2 (74 %) |
28 |
|
–– 39 ATUs |
|||||||
|
|
|
|
|
|
||
24 ATUs |
|
Kuzbass |
26.7 |
|
2 |
74 |
|
|
|
|
|
||||
3. Comparative analysis of old industrial coal mining regions in Europe and Russia. The comparative statistical and cartographic studies of the selected old industrial coal regions where coal has been mined for more than 150 years, has resulted in establishing that:
1. In European old industrial coal regions: Yorkshire, Wales, Fife (United Kingdom), Ruhr (Germany), Saarland (parts of the coal basin in Germany and France), Górnośląski (parts of the coal basin in Poland and the Czech Republic), Donbass (parts of the coal basin in Ukraine and Russia), Kuzbass (Russia), the value of population density per 1 sq. m. corresponds to the mean country value (or its major part within the established boundaries of ATUs), and in most cases is higher than this value.
82
Issue № 1(33), 2017 |
ISSN 2542-0526 |
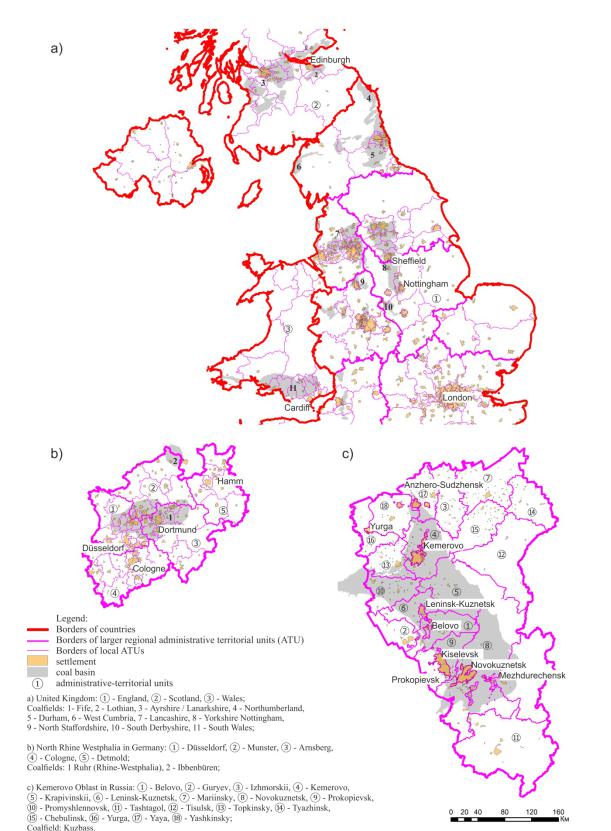
Fig. The current urban development situation in old-developed coalfields in Europe and Russia: а) the territory of coalfields in the United Kingdom, b) the territory of coalfields basins in North Rhine Westphalia, Germany, c) the territory of coalfields in the Kemerovo region of Russia
83

Russian journal of building construction and architecture
The average value of the density of population per 1 sq. km in the UK is 266 (Yorkshire –– 384, Fife –– 272), in the large part of the United Kingdom –– Wales is 144 (South Wales –– 140); in Germany the value is 227, in its major parts of the Land of North Rhine-Westphalia is 513 (Ruhr –– 694), in Saarland is 389 (Saarland –– 580); in France this value is 116 (French part of the Saar coal basin –– Lorraine –– 140); in Poland this indicator is 124 (Górnośląski –– 392); in the Czech Republic this value equals 133 (Górnośląski –– 526); in Ukraine this figure is 73 (Donbass –– 260).
2.In Russia in old industrial coal regions –– Donbass (a part of the coal basin in territory Rostov Oblast), Kuzbass –– the value of population density per1 sq. m is higher than the average for the country (or its large part within the established boundaries of ATUs).
The average value of the density in Russia is 8 thousand people per 1 square km, and in the coal basins of Donbass and Kuzbass the values of this index is 46 and 74 respectively.
3.In European old industrial coal regions: Yorkshire, Wales, Fife (United Kingdom), Ruhr (Germany), Saarland (parts of the coal basin in Germany and France), Górnośląski (parts of the coal basin in Poland and the Czech Republic), Donbass (parts of the coal basin in Ukraine and Russia), Kuzbass (Russia), despite the location of coalfields within several ATUs of different management levels, the population densityis higher than this value for non-coal regions.
4.Despite the fact that the share of coal districts in the total area of the countries (their major parts in ATUs), is not more than a quarter of the territory, the proportion of the population located in these areas in European countries is not smaller than the share of the area of such coal regions in the country. In particular: in the UK the coal mining area is 8 % and the population portion in this region is 9 %, respectively; in Germany this figure is 3 % (more than 15 %); in Poland –– this value is 2 % (13 %) in Ukraine this indicator equals 9 % (9 %) (Note 6).
5.The proportion of coal districts in the total area of Russia is not more than 15 % of the territory, and the proportion of the population located in the main coal mining regions is about 2 %. Moreover, in relation to large parts within the borders of administrative territorial units of the regional level, the proportion of Donbass in Rostov Oblast is 13 %, and the proportion of the population located in the of coal mining area is 14 % of the total oblast population; the share of Kuzbass in Kemerovo Oblast 28 % and 74 %, respectively.
Importance of the obtained results
The results of mapping and statistical analysis show that there is uncertainty due to the influence of environmental, geological and economic processes in the consideration of various old industrial coal mining areas, as well as the proposed analytical tools. None of the models is actually a complete representation of reality. However, there are objective evidence-based
84

Issue № 1(33), 2017 |
ISSN 2542-0526 |
patterns of development of old industrial coal areas located in major coalfields which do not disappear without trace, are not massively converted in the "ghost towns", and acquire new urban more complex forms.
Patterns and relationships, reflecting the current town planning situation are determined by the population density, the concentration of settlements and the ratio of the coal mining land area and the total area of the country and its large parts within the boundaries of administra- tive-territorial units. This is confirmed by scientists: "the vital settlement factors are the long rivers by which you can judge the geodynamics of active areas of the Earth's surface (to which mineral deposit zones belong)" [5], as well as "about 1/3 of all the cities of the world emerged on the basis of certain natural resources"[9].
The proposed cartographic analysis of the current urban situation in the first phase of the urban development project at interregional and international levels for the coal mining areas provides urban planners and researchers with another example of the use of GIS technologies, expanding the range of the previously known theoretical and practical studies with the use of GIS, e.g., to link remote sensing and regional census data, to use multiscale spatial and statistical analysis to assess the impact of re-developed areas on adjacent residential property [55]. Knowledge and timely assessment of the urban development potential taking into account the specific conditions and characteristics of land use will be useful for the old industrial, existing and new (potential) areas of coal mining around the world. Use of the urban development potential of the coal mining areas is important for Russia which does not have a high population density. Within the country it is advisable to overcome the centripetal direction of the Moscow megalopolis development with shrinking of the rest of the country's urban space.
The results can be used to improve energy sustainable policies and to deal with redevelopment of the territories disturbed by coal mining activities in various countries around the world that have minerals (coal), at other, previously non-applicable, inter-regional and international levels of urban planning of coal mining areas.
The proposed comparative analysis allows to investigate into similar phenomena for the lignite coal mining areas, to which Mosbass and Kizelbass belong in the territory of Russia, coal mining in which is fully completed.
Research in this direction with the use of modern information technology tools with the inclusion of a greater number of indicators and data can be continued.
Conclusions
The results of the comparative analysis evidences regularities of statistical relative indicators. The spatial arrangement of European and Russian old industrial coal mining areas, deter-
85