Материал: [2.1] 3D Imaging, Analysis and Applications-Springer-Verlag London (2012)

Chapter 10
High-Resolution Three-Dimensional Remote Sensing for Forest Measurement
Hans-Erik Andersen
Abstract High-resolution, optical, airborne remote sensing systems can capture detailed information on three-dimensional (3D) forest canopy structure. Individual tree biomass, volume, and carbon are highly correlated to tree height, so if individual tree heights can be efficiently measured using high-resolution remote sensing, it significantly reduces the cost of forest inventory and increase the quality of the information available to resource managers. We describe several techniques for the 3D remote sensing of forests. In the first category, we describe how aerial photogrammetric measurements, acquired from overlapping stereo digital imagery, can provide accurate 3D measurements of individual tree crowns. In the second category, we describe airborne laser scanning (LIDAR), which provides a 3D point cloud of laser returns from the forest canopy and underlying terrain.
10.1 Introduction
Accurate estimates of aboveground forest biomass, three-dimensional (3D) forest structure, and forest type and condition class are critical for monitoring of carbon dynamics, timber production, wildlife habitat, and canopy fuels. Typically, natural resource managers use measurements acquired at field plots to characterize the forest type, structure, and biomass resources within a particular area. The basic tree measurements and qualitative information collected at field plots usually include tree species, tree height, stem diameter at breast height (DBH, where breast height is defined as 1.3 m), crown ratio (the length of the crown as a percentage of total tree height), as well as the percentage of the merchantable stem that is rotten or otherwise not suitable for timber. Often, the position of the tree stem relative to the plot center (distance and azimuth) is noted so as to facilitate re-measurement in subsequent years. Although plot sizes vary depending on the available resources and forest types, measurements on small trees (seedlings and saplings) are usually acquired on a smaller regeneration plot. For example, in the national forest inventory system
H.-E. Andersen ( )
United States Department of Agriculture Forest Service, Pacific Northwest Research Station, Seattle, WA, USA
e-mail: handersen@fs.fed.us
N. Pears et al. (eds.), 3D Imaging, Analysis and Applications, |
417 |
DOI 10.1007/978-1-4471-4063-4_10, © Springer-Verlag London (outside the USA) 2012 |
|
418 |
H.-E. Andersen |
in the United States (Forest inventory and Analysis (FIA)), each plot consists of a cluster of four 1/60th hectare subplots spaced 36 meters apart, while trees smaller than 12.5 cm DBH are only measured on smaller 1/300th hectare microplots [7].
10.1.1 Allometric Modeling of Biomass
While these individual tree dimensions are sometimes of interest in their own right (e.g. for characterizing site productivity), often resource managers are interested in using these basic dimensional measurements to acquire indirect estimates of other tree attributes with more direct commercial and ecological significance, such as biomass, merchantable volume, and aboveground carbon. Allometric scaling principles in biology dictate that individual tree dimensions (height, DBH) will be functionally related to the total weight of the tree [55]. While DBH is the most common basic tree dimension used to estimate volume and biomass, tree height is also highly correlated with these variables (see Fig. 10.1). As Fig. 10.1 indicates, the relationship between tree height and biomass has the functional form: m = ah2, where m is biomass and h is tree height [31].
While the relationship between tree height and biomass is influenced by stand density, an advantage of using tree height, as opposed to DBH, to estimate biomass is that direct measurements of tree height can be acquired using high-resolution remote sensing data. Therefore, if allometric relationships are available relating tree height to biomass (possibly supplemented with stand density or crown width information), then it is theoretically possible to estimate individual tree biomass or volume using remote sensing data alone, obviating the need for field plots and thereby significantly reducing the cost of inventory.
In some forest types, however, it is very difficult, or even impossible, to accurately detect and measure individual tree crowns making up the dominant forest canopy layer. In this case, aggregate measures of forest structure obtained from three-dimensional remote sensing, such as airborne laser scanning, can be obtained over a specific area (usually a square grid cell or plot extent) and these structural metrics can be used to estimate the aggregate biomass level within this same area of forest using a predictive modeling (i.e. inferential) approach.
10.1.2 Chapter Outline
In this chapter, we will describe several techniques that can be used to detect and measure individual tree crowns using high-resolution remote sensing data, including aerial photogrammetry and airborne laser scanning (LIDAR), as well as approaches that can be used to infer aggregate biomass levels within areas of forest (plots and grid cells), using information on three-dimensional forest structure obtained from airborne laser scanning.

10 High-Resolution Three-Dimensional Remote Sensing for Forest Measurement |
419 |
Fig. 10.1 Relationships between tree height and aboveground biomass for several boreal forest
species in interior Alaska, USA [57]. Line shows the predicted values from the regression model, m = ah2
10.2 Aerial Photo Mensuration
In this section, we firstly describe the principles of aerial photogrammetry and then we go on to describe how this is used to form tree height measurements.
10.2.1 Principles of Aerial Photogrammetry
Aerial photogrammetry,1 or the science of making measurements from aerial photographs, has been used to support forestry applications for well over half a century
1It should be noted that the terminology describing identical geometric principles and analytical procedures often differs between the fields of photogrammetry and computer vision. For the purposes of clarity, the following table denotes the photogrammetry terminology and the corresponding computer vision terms:

420 |
H.-E. Andersen |
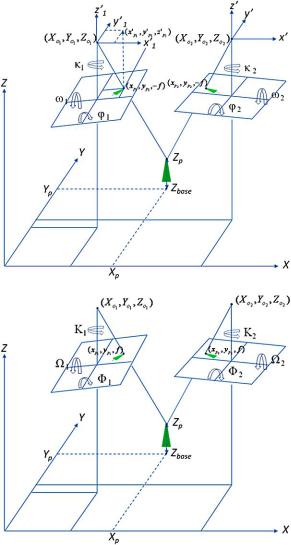
[43, 51]. Furthermore, aerial photo mensuration, or forest photogrammetry, is the science of acquiring forest measurements from aerial photographs [40]. As mentioned above, tree height is one of the most fundamental measurements in forest inventory and the use of aerial photogrammetry to collect accurate and precise tree height measurements from a remote platform is a primary goal of aerial photo mensuration. Although there are several methods used to acquire tree height information from aerial photos, the most reliable method of tree height measurement, if also the most complex and difficult to carry out in practice, is based on the measurement of stereo disparity on overlapping pairs of aerial photographs (see Fig. 10.2). From a mathematical standpoint, the measurement of tree heights within the overlap area of a stereo pair is carried out by taking the distance between the elevation measured at the base of the tree (Xp , Yp , Zbase) and the elevation measured at the top of the tree (Xp , Yp , Zp ) (see Fig. 10.2). Once the exact position and orientation of each photo in the stereo pair is determined (using ground control points and a procedure known as exterior orientation), then these elevations can be determined using the collinearity condition, which states that the ray from the optical center to the image feature and the ray from the optical center to the corresponding world feature are collinear. Given that two collinearities are formed on the same scene point, we can intersect them to determine the 3D location of the scene point (see Fig. 10.2) [56].
10.2.1.1 Geometric Basis of Photogrammetric Measurement
In mathematical terms, the collinearity condition for a feature on the ground (P) that is seen at point (p1) in image 1 (Fig. 10.2) is expressed by the so-called collinearity equations, based on the geometric principle that the ray from the optical center to the image feature and the ray from the optical center to the corresponding real world feature are collinear [56]:
xp1 |
− xo1 |
= −f |
m111 |
(Xp − Xo1 ) + m121 |
(Yp − Yo1 ) + m131 |
(Zp − Zo1 ) |
(10.1) |
|
|
|
|
|
m |
(X X ) m (Y Y ) m (Z Z ) |
|
||
yp1 |
− yo1 |
= −f |
311 |
p − o1 + 321 |
p − o1 + 331 |
p − o1 |
(10.2) |
|
m211 |
(Xp − Xo1 ) + m221 |
(Yp − Yo1 ) + m231 |
(Zp − Zo1 ) |
|||||
|
|
|
|
m |
(X X ) m (Y Y ) m (Z Z ) |
|
||
|
|
|
311 |
p − o1 + 321 |
p − o1 + 331 |
p − o1 |
|
|
Here the elements of the rotation matrix M = {mij }3i,j,3=1,1 are functions of the rotation angles (κ , ϕ, ω) that define the orientation of camera for each exposure:
Photogrammetry |
Computer vision |
|
|
Exterior orientation |
Extrinsic calibration |
Interior orientation |
Intrinsic calibration |
Conjugate points |
Corresponding points |
Exposure stations |
3D capture positions |
Space forward intersection |
Triangulation |
|
|
10 High-Resolution Three-Dimensional Remote Sensing for Forest Measurement |
421 |
Fig. 10.2 Geometric basis for measurement of tree heights using the collinearity principle and space forward intersection from a stereo pair of aerial photographs. For the purposes of clarity, the untilted image coordinate system (x, y, z) is only shown the top figure
m11 = cos(ϕ) cos(κ) |
|
|
m12 = sin(ω) sin(ϕ) cos(κ) + cos(ω) sin(κ) |
|
|
m13 = − cos(ω) sin(ϕ) cos(κ) + sin(ω) sin(κ) |
|
|
m21 |
= − cos(ϕ) sin(κ) |
|
m22 |
= − sin(ω) sin(ϕ) sin(κ) + cos(ω) cos(κ) |
(10.3) |
m23 |
= cos(ω) sin(ϕ) sin(κ) + sin(ω) cos(κ) |
|
m31 |
= sin(ϕ) |
|