Материал: [2.1] 3D Imaging, Analysis and Applications-Springer-Verlag London (2012)
10 High-Resolution Three-Dimensional Remote Sensing for Forest Measurement |
427 |
read continuously by the detector and the accumulated images are digitally shifted in such a way as to correct for the movement of the aircraft during the time that the shutter is open [39].
The accuracy of manual tree height measurements using photogrammetry usually depends upon the ability of the interpreter to see both the base and top of the tree. Due to the characteristics of the tree crown and in particular, the size of the crown apex, the species of tree will influence the accuracy of photogrammetric tree height measurements. For example, Kovats [23] found that with large-scale photographs measured under an analytical stereo plotter instrument, lodge pole pine tree tops were larger and could be measured more accurately than relatively small Douglas-fir tree tops [13]. This study found that when tree tops were visible, tree heights could be measured very accurately (0.05 ± 0.59 m (mean error ± standard deviation (SD))) with large scale (1 : 1200) photography. In dense, closed canopy forests on mountainous terrain it is often impossible to see through the forest canopy and therefore the base of trees cannot be accurately measured. This leads to increasing tree height error as forest canopy closure and terrain roughness increase. Other studies have shown that large scale non-metric (i.e. non-mapping) 35-mm camera could be used to accurately measure stem counts and determine species in a loblolly pine plantation in Virginia [38].
In general, the process to obtain individual tree measurements and attributes from digital aerial images within a digital photogrammetric workstation consists of the following steps:
1.Obtain overlapping aerial stereo imagery (using digital camera or scanned film imagery)
2.Carry out interior orientation using camera calibration information
3.Carry out exterior orientation using either direct georeferencing (obtained using airborne GPS and IMU) or ground control points
4.Manually measure tree dimensions and digitize features using collinearity condition and space forward intersection (Fig. 10.2).
5.Export coordinates and attributes of trees for further analysis within a geographical information system (GIS).
10.2.2.2 Automated Methods in Forest Photogrammetry
To a large extent, acquisition of accurate individual tree measurements from digital aerial photographs requires the use of manual techniques. Given the complexity and irregularity of imaged forest scenes, which are composed of various vegetation and ground surface components with differing textures, spectral signatures, shadow patterns, as well as the fact that every image represents a different perspective on these complex and irregular features, it is very difficult to efficiently automate the acquisition of forest photogrammetric measurements. However, this has been an active area of research over the last 10–15 years, and progress has been made.
428 |
H.-E. Andersen |
Several studies in the 1990s and early 2000s investigated the possibility of automatically extracting individual tree-level measurements from high resolution imagery in a two-dimensional space. Gougeon developed a shadow-following technique that effectively delineated individual tree crowns in both aerial photographs and high resolution satellite images [17]. Brandtberg and Walter used multiple scale analysis to extract individual tree crowns from aerial images [9]. Both Larsen and Rudemo [24] and Pollock [42] used template-matching techniques to detect individual trees in aerial images. Lund and Rudemo [27] developed a probabilistic approach to identifying individual tree crown tops in digital imagery based on a stochastic point process model. Larsen and Rudemo [24] have since extended this model to a three-dimensional point pattern using multiple image views, although the technique is still largely theoretical in nature. Gong et al. [15] developed a semi-automated method to extract tree measurements using a three-dimensional generalized ellipsoid model for tree crown shape. Culvenor [10] developed a technique called the tree identification and delineation algorithm (TIDA) based on (1) identification of local maxima, (2) identification of local minima, and (3) clustering of crown pixels, where local maxima are used as seed points for the clustering and local minima are used to constrain the clustering. Due to the difficulty of finding individual tree crown positions, however, this method relied on manual determination of tree top and base.
Other approaches have concentrated on the automated measurement of canopy surface models from digital stereo imagery, instead of direct extraction of individual tree crowns. This approach involves the automated identification of conjugate points (image points corresponding to the same object on the ground) in the overlapping areas of stereo imagery, and then uses the collinearity equations (described above) to calculate the elevation of each surface point throughout the overlap area. The process of locating conjugate points throughout the overlap area is called image matching. Although this approach does not attempt to isolate individual tree crowns, image matching in a forested area is also complicated by many of the same factors as the individual tree methods, including (1) occlusions, (2) repetitive patterns, (3) shadows, perspective differences, (4) semi-transparent surfaces, and (5) rough, discontinuous surfaces [25]. Although most digital photogrammetric software packages provide image matching and surface generation capabilities, these systems are usually designed to generate digital terrain models in relatively unvegetated areas and usually yield disappointing results over forests. That being said, attempts have been made to develop image matching algorithms that are more effective in forested areas. For example, Li and Gruen [25] developed an approach that matches both grid points, textural and edge features, uses geometric constraints to limit the search space, and employs two different matching techniques (sum of modified cross-correlation and least-squares matching) to improve the accuracy of matching results in complex forested scenes. The technique combines both area-based matching (ABM) and feature-based matching (FBM) approaches, and employs a hierarchical approach moving from coarse to finer resolutions in the matching process. A triangular irregular network (TIN) surface is generated at each level of the resolution hierarchy, and a modified multi-photo geometrically constrained (MPGC) matching algorithm
10 High-Resolution Three-Dimensional Remote Sensing for Forest Measurement |
429 |
is used to further refine the surface, remove any remaining errors, and achieve subpixel accuracy [25]. The results obtained from this algorithm were compared to surfaces generated using commercial digital photogrammetric image matching algorithm (SocetSet) and airborne laser scanning (LIDAR, 1 m point spacing) in a mire environment in Switzerland, and found that results from their algorithm were better than those obtained with the commercial system and at least as dense and of similar accuracy as those obtained from LIDAR [5]. It should be noted that the LIDAR data used in this study was relatively low resolution (1 m). However, the results from this study indicate that there is potential for using automated image matching techniques to generate accurate forest canopy surface models.
10.3 Airborne Laser Scanning
In this section, we firstly describe the principles of airborne laser scanning and then go on to detail how individual tree-level measurement are made using LIDAR. Finally, we outline the area-based approach to estimating biomass with LIDAR.
10.3.1 Principles of Airborne Laser Scanning
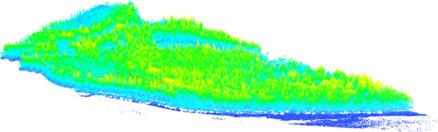
The other optical remote sensing technology capable of providing high resolution measurements of forest canopy structure is airborne laser scanning (also known as light detection and ranging, or LIDAR). Airborne LIDAR systems consist of a laser system that emits pulses at a very high rate (typically 100,000–167,000 Hz) in a scanning pattern beneath the aircraft. Precise measurement of the time-of-flight of an individual laser pulse, multiplied by the speed of light (a known constant), provides the range between the laser instrument and reflecting surfaces below. If the exact position and orientation of the laser system is also known at the moment each pulse is emitted, provided by airborne GPS and an inertial measurement unit respectively (the same enabling technologies used in direct georeferencing of aerial photography), then the 3D coordinate associated with each laser reflection can be calculated [4]. These so-called discrete-return airborne scanning systems generate a dense cloud of 3D points in a swath along the flight path of the aircraft. Most commercial LIDAR systems can record multiple returns from a single pulse, therefore, in a forested area, the point cloud provides information on the 3D forest canopy structure in a given area (see Fig. 10.4).
In recent years, airborne LIDAR systems have provide the entire waveform associated with each LIDAR pulse, instead of the discretized point data. These fullwaveform LIDAR systems depict the full measurement process of the LIDAR system and therefore have the potential to provide even more detailed picture of the three-dimensional distribution of forest canopy components beyond what is available from discrete-return systems [54]. Although processing and analysis of full
430 |
H.-E. Andersen |
Fig. 10.4 Lidar data swath, upper Tanana valley of interior Alaska, USA. Points are color-coded by height (blue: low, green: medium, yellow/red: high)
waveform LIDAR data is still an evolving research field, recent progress has been made in establishing the theoretical basis for modeling the signal obtained from a full-waveform LIDAR system, where the signal is modeled as a series of Gaussian pulses [54]. Other studies have indicated great potential for using the additional information from full-waveform to characterize tree species composition and other forest attributes [45, 52].
The intensity (reflected energy level) associated with each LIDAR return (reflection) is also provided along with the 3D coordinate. Since most LIDAR systems operate in the near infrared portion of the electromagnetic spectrum (e.g. 1064 nm), which is sensitive to the chorophyll content and condition of vegetation, LIDAR intensity can provide additional information for forest characterization.
As with aerial photography, the properties of airborne LIDAR data are a function of the specific LIDAR system employed and system settings, such as pulse frequency, scan rate, beam divergence, scan angle, as well as a number of variable flight parameters, such as nominal flying height above ground level (AGL) and aircraft ground speed. In addition, LIDAR intensity information can be affected by the specific settings of the automatic gain control system and the AGL [13]. Previous studies carried out in Australia have indicated that, although acquiring LIDAR from platform altitudes as high as 3000 meters can still allow for quantification of forest structure, data acquired from higher altitudes will have fewer ground points available for generation of accurate digital terrain models, and the lower data density will have a detrimental effect on the accuracy of individual tree crown detection and measurement [16].
10.3.1.1 Lidar-Based Measurement of Terrain and Canopy Surfaces
Because LIDAR provides direct measurements of three-dimensional canopy structure, as well as the underlying terrain surface, the most fundamental products provided by airborne LIDAR are the canopy surface model and digital terrain model. Previous research has indicated that LIDAR-derived terrain models can be highly accurate (i.e. root mean square error (RMSE) <0.50 m), even under relatively dense coniferous forest canopy conditions found in the Pacific Northwest region of the
10 High-Resolution Three-Dimensional Remote Sensing for Forest Measurement |
431 |
United States [47]. Several algorithms have been developed for filtering out the ground returns from LIDAR data, although much of this research and development work has been carried out in the commercial sector and is considered proprietary. Even after the ground reflections have been filtered out from the all-return data set, there is variability in the derived terrain model due to the choice of the gridding algorithm. Bater and Coops [6] evaluated the error in the LIDAR-derived terrain models associated with various interpolation algorithms including linear, quintic, natural neighbor, regularized spline, spline with tension, a finite difference approach, and an inverse distance weighted interpolation algorithm at spatial resolutions of 0.5, 1.0, and 1.5 meters, and found that 0.5 meter terrain models were the most accurate, and the natural neighbor algorithm provided the best results for interpolation, although the differences in accuracy between the algorithms were minor.
Given the highly irregular and ill-defined nature of a forest canopy surface, the characteristics of LIDAR-derived canopy surface models are highly dependent upon type of filtering and interpolation algorithms employed as well as the input parameters of these algorithms. The most common approach to generating LIDAR canopy surface models is to extract the highest LIDAR return within a given grid cell area and then employ an interpolation algorithm, such as kriging, linear, or inverse distance weighting (IDW), to generate a regular grid [44]. Often, additional processing is required to remove anomalous elevations within the surface and produce an accurate representation of the true canopy surface [8].
10.3.2 Individual Tree-Level Measurement Using Lidar
Airborne LIDAR can be used to acquire highly accurate measurements of individual tree height (Fig. 10.5). In a test carried out in western Washington, Andersen et al. [1] investigated the influence of beam divergence setting (i.e. laser footprint size), species type (pine vs. fir), and digital terrain model error on the accuracy of height measurements. This study found that tree height measurements obtained from narrow-beam (0.33 m), high-density (6 points/m2) LIDAR were more accurate (mean error ± SD = −0.73 ± 0.43 m) than those obtained from wide-beam (0.8 m) LIDAR (−1.12 ± 0.56 m). This was likely due to the fact that with wide-beam LIDAR the energy is spread out over a large area, which decreases the strength of the returns from a tree top and lessens the likelihood that they exceed the noise threshold [35]. In addition, this study found that tree height measurements on Ponderosa pine were more accurate (−0.43 ± 0.13 m) than those obtained for Douglasfir (−1.05 ± 0.41 m), largely because the size of the Douglas-fir leader is a smaller target than the top of a Ponderosa pine tree. These results were consistent with the accuracies for LIDAR-based tree height measurements reported in other studies in various forest types [14, 28, 48].