Материал: Russian Journal of Building Construction and Architecture
Issue № 4 (36), 2017 |
ISSN 2542-0526 |
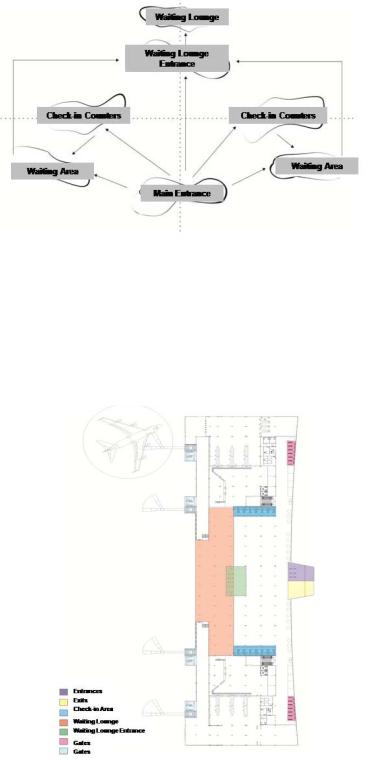
Fig. 2. Function scheme of terminal building designed with columns
The airport terminal building that is designed with this function scheme and the solution of which is produced with columns is given in Fig. 3.
Fig. 3. Plan of terminal building designed with columns
This design is problematic for airport terminal buildings because columns create problems in spaces where circulation is dense. The entrance control hall is designed as 60 m². It features 6
11

Russian Journal of Building Construction and Architecture
X-ray systems and 26 ticket control counters. As indicated in the plan, the columns will not only affect general passenger movement, but also the passengers that will line up in the ticket control area. At the entrance of the departure hall, there are 4 X-ray systems. In order to indicate the hall entrances, this area has been tried to be divided with screens. As in the ticket control area, the problems that the columns create for the lining up passengers can be observed in the plan. In the designed terminal building, passengers who leave the entrance area encounter the departure hall security control area. The ticket control points are situated parallel to the entrance axis. Although ample space has been left between the entrance-ticket control and departure hall, the column solution limits mobility. Moreover, the axis movements of passengers who head towards the rest area and passengers who come from the rest area can result in clashes in case of passenger density. The terminal building was analyzed with ATArch-A. Numbers at peak hours, passenger characteristics and other input components are presented in Table 1.
Table 1
Input components of design with columns
Ave. Waiting |
PBPH |
PPH |
B |
PC |
EH- |
BK |
CHE- |
Gap |
E/TC/CH |
XRAY |
XRAY |
|
|||||
|
|
|
|
|
|
|||
|
|
|
|
|
|
|
|
|
21/35/19 |
97 |
105 |
L |
75M/75Y/85N |
3 |
5 |
2 |
6 |
|
|
|
|
|
|
|
|
|
24/40/21 |
198 |
210 |
N |
80M/80Y/80N |
3 |
5 |
2 |
6 |
|
|
|
|
|
|
|
|
|
25/45/23 |
255 |
270 |
N |
85M/80Y/85N |
3 |
5 |
3 |
7 |
|
|
|
|
|
|
|
|
|
27/50/25 |
303 |
321 |
N |
90M/95Y/90N |
4 |
5 |
3 |
7 |
|
|
|
|
|
|
|
|
|
30/55/27 |
415 |
439 |
H |
75M/75Y/70N |
4 |
6 |
4 |
7 |
|
|
|
|
|
|
|
|
|
The meanings/definitions of the abbreviations in the table are given below.
|
Table 2 |
|
List of abbreviation definitions |
|
|
|
the average waiting time of the passengers in the areas (E, average waiting time in the entrance |
Ave. Waiting |
control hall; TC, average waiting time at ticket control counters; CH, average waiting time in |
|
departure hall) |
|
|
PPH |
number of passengers at peak hour |
|
|
PBPH |
number of passengers before peak hour |
|
|
PC |
Passenger characteristics |
|
|
12
|
Issue № 4 (36), 2017 |
ISSN 2542-0526 |
|
|
|
|
|
End of Table 2 |
|
|
|
|
|
|
|
EH-XRAY |
Number of active X-Ray systems in entrance control hall |
|
|
|
|
|
|
|
|
TC |
Number of open counters in ticket control area |
|
|
|
|
|
|
|
|
CHE-XRAY |
Number of active X-Ray systems at the departure hall entrance |
|
|
|
|
|
|
|
|
Gap |
The time for passengers to add to each other in the areas |
|
|
|
|
|
|
|
|
M |
Percentage of male passengers |
|
|
|
|
|
|
|
|
Y |
Percentage of young passengers |
|
|
|
|
|
|
|
|
N |
Percentage of passengers of normal weight |
|
|
|
|
|
|
|
|
B |
Passenger luggage carrying condition |
|
|
|
|
|
|
|
|
L |
Passengers with little luggage (Passengers with only hand luggage) |
|
|
|
|
|
|
|
|
N |
Passengers with normal luggage (1 and/or 2 pieces) |
|
|
|
|
|
|
|
|
H |
Passengers with normal luggage (1 and/or 2 pieces) |
|
|
|
|
|
|
|
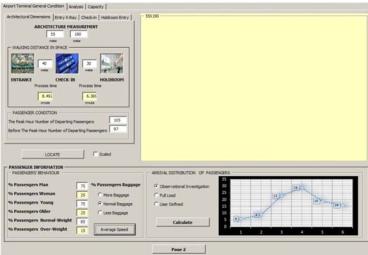
The distances between spaces (entrance control hall-ticket control, ticket control-departure hall) were determined, and when the data were separately fed to the ATArch-A environment, Fig. 4 emerged.
Fig. 4. ATArch-A analysis of terminal building designed with columns
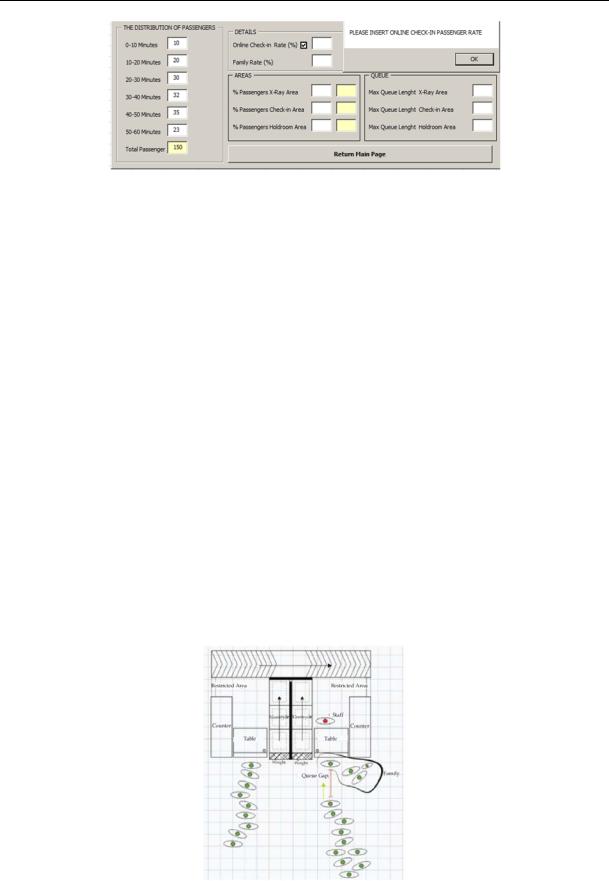
When the data were fed to ATArch-A, the program indicated the time to cover the distances between the spaces as process time. However, when the passenger arrival times were analyzed with data of previous observations that were stored in the database of ATArch-A, the graphical distribution given in Figure 4 was obtained. In addition, the user can enter passenger arrival distributions. As seen in Fig. 5, hourly passenger data can be entered.
13
Russian Journal of Building Construction and Architecture
Fig. 5. ATArch-A entrance of passenger numbers for terminal building designed with columns
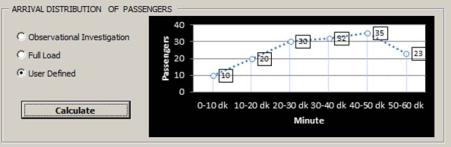
Instead of manual feeding of hourly passenger distributions, the percentage of passengers using online check-in can be entered as well. While performing analyses with ATArch-A, many algorithms overlap with each other. One of the most important design problems in terminal buildings is function complexity. Therefore, it is important to know how different functions will operate with respect to their practical value. While designing airport terminal buildings, especially the characteristics of passengers need to be considered. The ATArch-A software includes a passenger characteristics menu which displays the effects of passengers’ physical conditions on the space. In addition, the passengers’ family rate option was developed for manual feeding of passenger arrival distribution. This option was developed as a result of observations conducted at airports. It was seen that passengers line up at the entrance control hall, ticket control counters, or departure hall entrances. Especially at the ticket control counters, passengers’ line up one after another. However, observation revealed that some passenger groups did not line up behind another but next to another, which is related to the family or group phenomenon. This queuing form is presented in Fig. 6.
Fig. 6. Passenger queuing form at the ticket control counters
14
Issue № 4 (36), 2017 |
ISSN 2542-0526 |
When passengers line up in groups or as a family, they prefer to wait next to rather than behind each other. This changes the line length and waiting time because while one family member has their ticket checked at the counter and is waiting for it to finish, the other members wait right by their side at the counter as well. This is also often the case when tour operators come with large groups of passengers. Only one person or the tour leader deals with the procedures of passengers from the same country while the others stand around and wait in scattered fashion instead of a straight line, which can affect the line length in front of the counter. To address this situation, the “Family Rate” variable of the ATArch-A was developed to ask for the group percentage of the group in the number of passengers. For example, if this is entered as 20 %, 1 in 5 passengers will be counted as family. The family rate analysis is the calculation of process time of the group procedures, which is different than the process time calculation of separate passengers. As it will change the length of the line formed behind the counter, it is an important input variable. On the second page of ATArch-A, where the user can enter the passenger distribution, the percentage of passengers using online check-in, and the family rate, it is also possible to determine the percentage of passengers that will head to spaces. In the “Areas” module, the ratio of passengers that will also use the 3 different spaces (entrance control hall, ticket control area, and departure hall entrance) they are moving toward can be indicated. After the data are entered, ATArch-A can produce the graph for the passenger distribution as the user wishes, as in Fig. 7.
Fig. 7. Revised ATArch-A analysis of passenger arrival distribution for terminal building with columns
The determined values were fed to the ATArch-A analysis resulting in Fig. 8.
In the ATArch-A screen view presented in Fig. 8, it is observed that the size of the area in m2 allocated to the different spaces is sufficient, and that the entrance control hall and the ticket control areas are sufficient when the algorithm between the number of passengers and the space, and the IATA data are considered. The departure hall entrance is of B Level of Service,
15