Материал: Russian Journal of Building Construction and Architecture
Russian Journal of Building Construction and Architecture
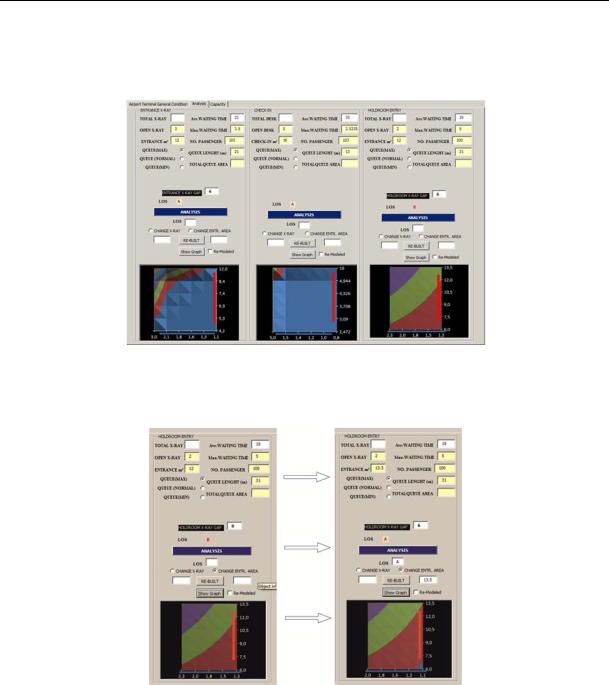
which is adequate by IATA standards. If the user wishes to change the space inputs, ATArch-A defines the necessary area as shown in Fig. 9 to increase its level to A.
Fig. 8. ATArch-A analysis for terminal building with columns
Fig. 9. Service level analysis for terminal building designed with columns
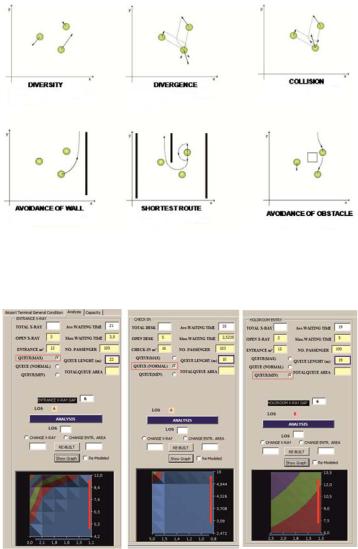
Furthermore, ATArch-A analyzes passengers’ queuing conditions. It uses Fruin (1971) analysis for passengers that line up one behind another (Fig. 10). When ATArch-A forms this algorithm, it calculates the sizes of the passenger according to the accepted values of Fruin (1971).
Based on this, ATArch-A can calculate the length of passenger lines with the assumption that passengers line up one behind another in a single line without distorting it. By this way it is possible to calculate the maximum possible length of the line and to design the spaces accord-
16
Issue № 4 (36), 2017 |
ISSN 2542-0526 |
ingly. As Figure 11 shows that when the number of entrance X-ray systems is reduced to 2, the level of service instantly drops to “C” level.
Fig. 10. Fruin human movement and ATArch-A accepted values
Fig. 11. ATArch-A line length analysis
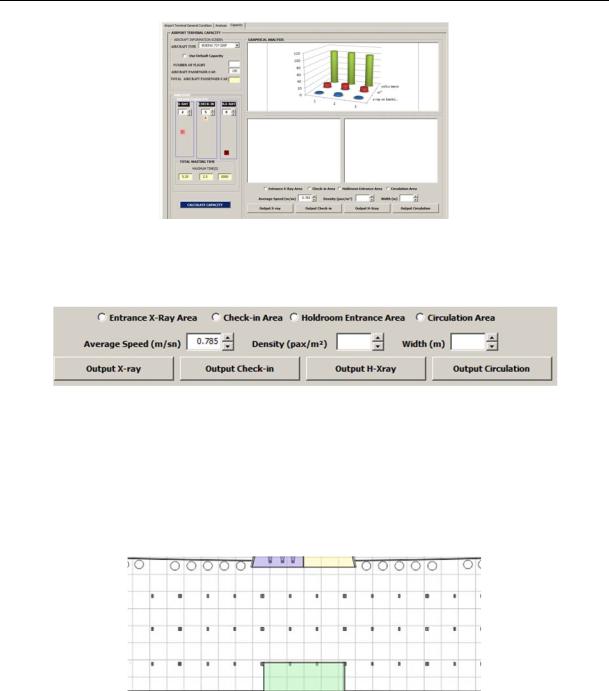
In addition to the decrease in level of service, the maximum waiting times also change. The same algorithm operates in the same manner for the other spaces. Moreover, by changing the operating counters or X-ray systems in the ATArch-A capacity interface, the level of service can be immediately analyzed (Fig. 12).
In the capacity interface, ATArch-A analyzes passenger flow conditions and performs graphical analyses (Fig. 13) by using speed, average density, and space width. This analysis of ATArch-A is usually employed in the design of circulation spaces.
17
Russian Journal of Building Construction and Architecture
Fig. 12. ATArch-A analysis of momentary change in level of service
Fig. 13. ATArch-A passenger flow analysis interface
ATArch-A analyzes the terminal building system solved with columns with the interface it develops. The analyzed circulation space is shown in Fig. 14.
Fig. 14. The circulation area of the space
In this space, the circulation areas are assumed to be the area between the columns because especially passengers walking in groups (crowds) tend to identify an axis for themselves and to proceed along that axis (Teknomo, 2008). As observed, in circulation systems designed with columns, flow and level of service are lower due to square meter area limitations because columns are situated within the circulation area, take up space, and reduce the circulation area in square meter.
18
Issue № 4 (36), 2017 |
ISSN 2542-0526 |
Terminal Building Designed without Columns
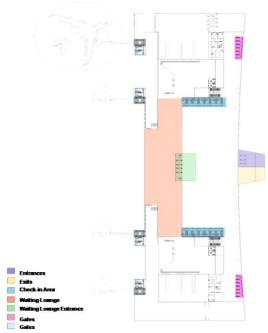
In another terminal building design, where the linear design logic and function scheme were kept identical, especially the circulation spaces and the spaces with high passenger density were totally designed without columns (Fig. 15). This design is the main concept of especially recently designed airports (such as Beijing Airport, China).
Fig. 15. Plan of terminal building designed without columns
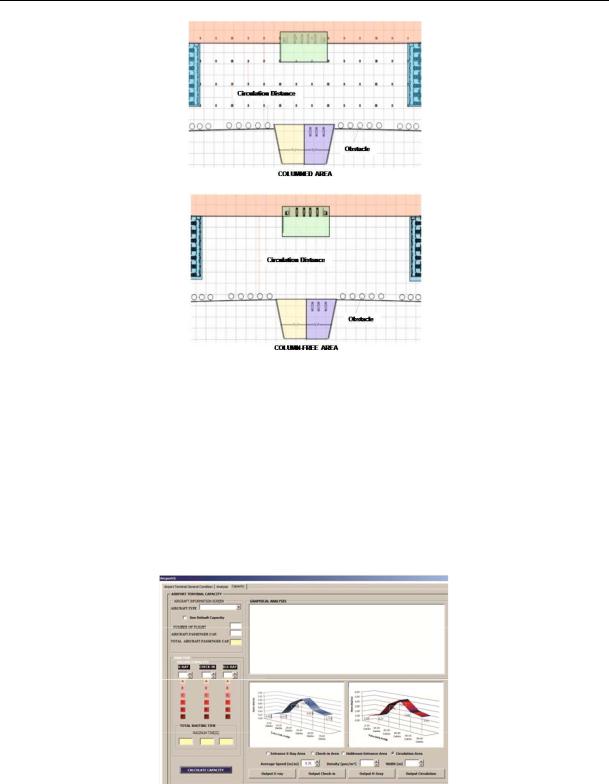
In the circulation system solved without columns, the seating areas were assumed to be located in the farthest point. The other spaces remain in the same place, and only the circulation area expanded. The relationship between the circulation spaces with and without columns is as in Fig. 16.
The solution with columns here is not like a real solution; instead of columns, barriers or seats could stand as well. What follows from this is similar to the result in Figure 4.90 revealed with ATArch-A analysis. In the comparison presented in Figure 16, the width of the first circulation space was assumed to be 7.5 meters. ATArch-A assumed the number of passengers to use this space as the 150 passengers that ATArch-A assumed to go to ticket control at peak hour, and the 142 passengers before peak hour. This assumption is based on the theory in the work of Hsu and Chao (2005) that states that the passengers using the circulation space consist for the most part of those that spread from the ticket control area.
19
Russian Journal of Building Construction and Architecture
Fig. 16. The relationship between circulation spaces with and without columns
On the other hand, speed is taken as the average speed that ATArch-A determines according to passenger characteristics. In the circulation space without columns presented in Fig. 16, the width of the space is taken as 30 meters, though with the same number of passengers. The graphic analysis and interface screen of ATArch-A for these conditions are shown in Fig. 17.
Fig. 17. ATArch-A passenger flow analysis for circulation spaces with and without columns
The first blue line on the ATArch-A capacity screen shows the passenger flow and arrival distribution graph to occur in the circulation space with columns. In the red graph, the same pas-
20