Материал: Russian Journal of Building Construction and Architecture
Issue № 4 (36), 2017 |
ISSN 2542-0526 |
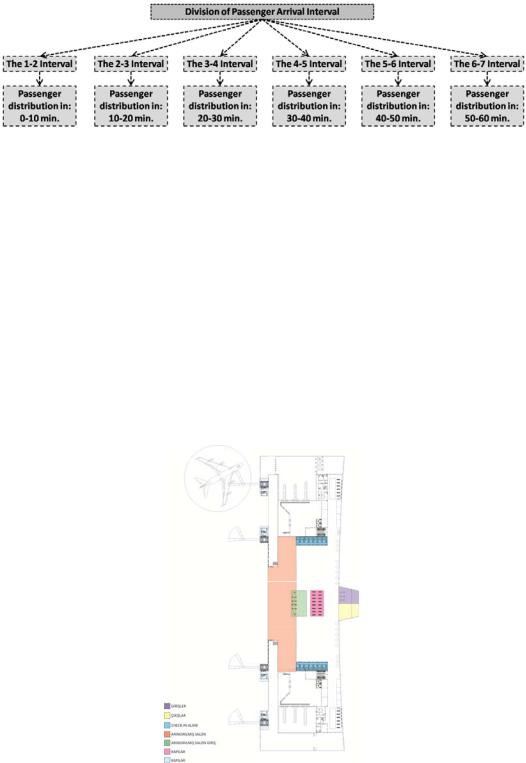
senger distribution and passenger density was taken, and flow was observed to increase only due to the expansion in circulation space. In the graph that ATArch-A produced, the passenger arrival intervals are divided into 7 parts (Fig. 18).
Fig. 18. Passenger arrival intervals for ATArch-A analysis
Thus, ATArch-A can calculate hourly passenger flow. When the problems that a linearly designed airport system will cause in the circulation are considered, a solution without columns was determined. Additionally, the location of seating groups in a linear terminal system is quite important. Whether a space will be divided into seating groups or not, or whether the seating groups will be solved in an expandable space or not is an issue that should not be ignored in the design of terminals. In Fig. 19, the seating groups are placed in the circulation space but close to the departure hall entrance. The possible results of this placement can be analyzed with ATArch-A.
Fig. 19. Strategy for seating group placement in terminal building -A
21
Russian Journal of Building Construction and Architecture
The values for the peak hour passenger numbers were entered for ATArch-A. Distances, especially distance to departure hall entrance, and line lengths probable to occur were analyzed. The determined flight is as in Table 3.
|
|
|
|
|
|
|
Table 3 |
|
|
|
Input components for ATArch-A analysis |
|
|
|
|||
|
|
|
|
|
|
|
|
|
Ave.Waiting |
PBPH |
PPH |
B |
PC |
BK |
CHE-XRAY |
Gap |
|
E/TC/CH |
||||||||
|
|
|
|
|
|
|
||
|
|
|
|
|
|
|
|
|
24/40/21 |
198 |
210 |
N |
80M/80Y/80N |
5 |
2 |
6 |
|
|
|
|
|
|
|
|
|
|
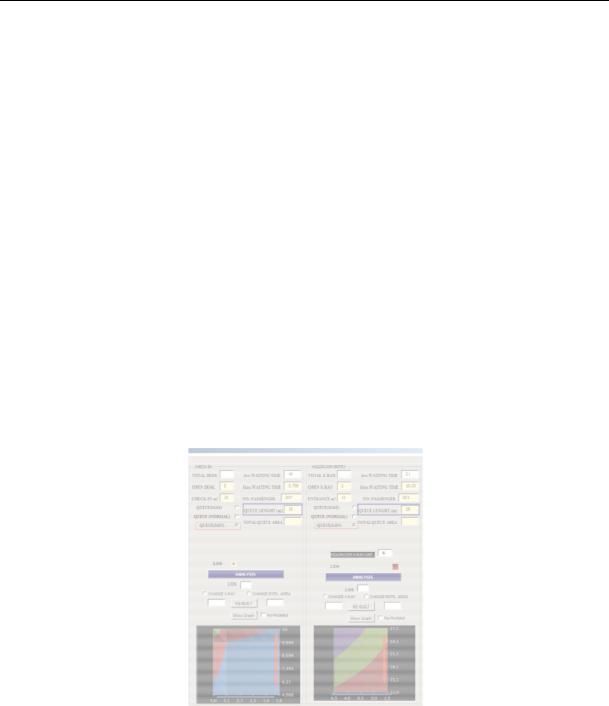
Here, the average waiting times in spaces, number of passenger at and before peak hour, open ticket control counters and X-ray systems, and passenger addition times are listed. Data related to entrance control hall were not considered as they are directly relevant to the space to be analyzed, departure hall entrance, and ticket control space. The ATArch-A analysis is given in Fig. 20.
Fig. 20. Placement strategy-A ATArch-A line length and level of service analysis
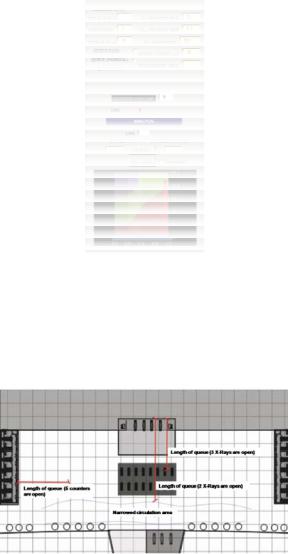
As the ATArch-An analysis show, when peak hour passenger numbers are entered, the minimum ticket control line length becomes 16 meters and the departure hall line length 38 meters. While no problem is observed in the ticket control area, the departure hall level of service is found to be “F”. If one more X-ray system is opened under these conditions, this level rises to “B” and the minimum line length drops to 25 meters (Fig. 21).
22
Issue № 4 (36), 2017 |
ISSN 2542-0526 |
Fig. 21. Placement strategy-A ATArch-A analysis of line length in front of departure hall
When all the data and the designed plan strategy are considered, Fig. 22 emerges.
Fig. 22. Placement strategy-A ATArch-A analysis indicated on the plan
As can be seen in the sketch, the queue prolongs into the waiting area, substantially obstructing the circulation area. It is possible to prevent this obstruction by means of making walkways, which is to be implemented in front of the departure hall. However, locating seating groups in front of the departure hall is regarded as an architectural design mistake in terms of functionality. Having determined that the seating groups cannot be located in front of the departure hall, the fact that, in several small-scale and medium-scale airports, the waiting area is located in front of the check-in counter needs to be further analyzed. As can be seen in Fig. 23, seating groups are located within the circulation space, yet near the check-in counters. Designed as “Strategy B”, this is a commonly used method. The front of the departure hall in Strategy “A” is left empty in this design.
23
Russian Journal of Building Construction and Architecture
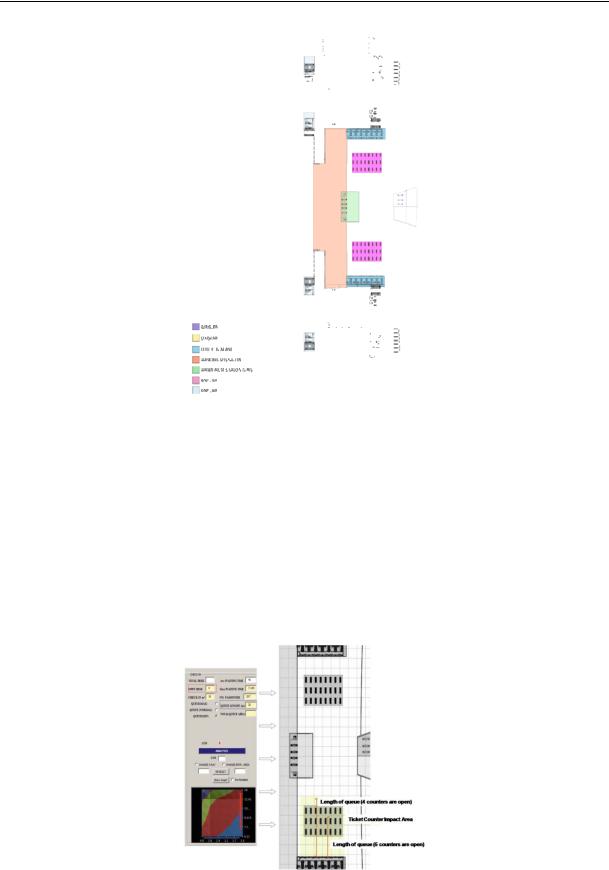
Fig. 23. Arrangement of seating groups in the terminal building-layout strategy B
Considering that the flight data belonging to the previous strategy was used, ATArch-A is expected to reach the previously done analyses. However, the previous analysis is based on when all 5 check-in counters are open. The possible queue length and service level when less than 5 counters are open is to be effective in deciding whether or not to choose this design (Fig. 24).
Fig. 24. Layout strategy-B ATArch-Analyses and depiction on sketch
24
Issue № 4 (36), 2017 |
ISSN 2542-0526 |
As can be seen in the ATArch-A analysis, the service level decreases as the number of ticket counters decreases, leading to longer queues. Possible lengths of queues that may occur in such a case are marked on the sketch, and this region is labeled “check-in activity area”. It has been observed that the absence of seating groups within the activity range of check-in counters is significant for the service quality and queue length. Thus, seating groups (regardless of how many there are) should not be organized in front of the check-in counters. If there is such a restriction, that is, if seating groups should be eliminated from in front of the check-in counters because of insufficient space, the place of seating groups should be arranged based on sound observation of the peak time of passengers using a particular airport. This analysis clearly demonstrates that placement of check-in area in the circulation area may bring about problems as to the queue axis. The main rationale is that it should not have any effect on the circulation area. However, when the check-in counter-desks are placed in this way, the queues may stretch up to the entrance of departure hall, causing congestion and several inconveniences. Determination of the location of certain spaces in a terminal design is critical because there is a direct relation between these spaces. Therefore, especially the main spaces (check-in lounge, check-in point and departure hall entrance) should be dealt with considering the interaction between them. The place of check-in counters, as well as other spaces, should be carefully designed, especially in large-scale airports. After all, check-in area is where passengers have to wait and are delayed most commonly. The location of this area determines its efficiency. The situation of certain service points where the average time individual or group passengers spend to receive service is important because it has a direct effect in increasing or decreasing this average time. In addition, the distance between the entrance control point through which a passenger passes with her/his luggage and the closest check-in desk up to which s/he has to walk with his luggage has to be kept at minimum. The check-in counter is an actively operating space. It is important that the passengers’ movement area not restricted because of irregular opening and closing of counters and changing of line-up paths according to volume of passengers. Fig. 25 exemplifies the way check-in counter can be situated in the terminal building.
The layout plan displayed by the image is the most commonly used design in today’s airport systems. It is widely accepted that this plan allows for more orderly queuing of passengers and, because such queuing has a vertical impact on the circulation, it does not cause the problems in the other layouts. In addition, this will help the sustainability of systems for separating and conveying baggage, and their secure transportation. Replication of ATArch-A analysis with the same number of passengers and data results in Fig. 26.
25