Материал: Scientific Herald of the Voronezh State University of Architecture and Civil Engineering

Scientific Herald of the Voronezh State University of Architecture and Civil Engineering. Construction and Architecture
Table 2
Distribution of temperature during cooling of the hot mix in time at different air temperatures
|
Time, min |
0 |
5 |
10 |
20 |
30 |
40 |
50 |
60 |
Dependence |
|
|
|
|
|
|
|
|
|
|
|
|
|
|
|
–10 |
160 |
142 |
126 |
99 |
79 |
64 |
53 |
45 |
t = 160e-0,022τ |
°С |
|
0 |
160 |
143 |
128 |
102 |
84 |
70 |
59 |
52 |
t = 160e-0,02τ |
|
5 |
160 |
143 |
129 |
104 |
86 |
73 |
63 |
55 |
t = 160e-0,019τ |
|
temperature, |
|
|
|
|
|
|
|
|
|
|
|
|
10 |
160 |
144 |
130 |
106 |
88 |
75 |
66 |
58 |
t = 160e-0,018τ |
|
|
20 |
160 |
145 |
132 |
110 |
93 |
81 |
72 |
65 |
t = 160e-0,016τ |
|
|
30 |
160 |
146 |
134 |
113 |
98 |
86 |
78 |
72 |
t = 160e-0,0147τ |
|
Air |
|
|
|
|
|
|
|
|
|
|
|
|
40 |
160 |
147 |
136 |
117 |
102 |
92 |
84 |
78 |
t = 160e-0,0133τ |
|
|
|
||||||||||
|
|
50 |
160 |
148 |
138 |
120 |
107 |
97 |
90 |
84 |
t = 160e-0,0119τ |
The above data suggest that regardless of the air temperature, the distribution of the temperature in time conforms to general laws and can be described with an exponential dependence. A correlation coefficient for all the equations ranges from 0,98 to 0,99. In order to identify the general laws of the influence of the air temperature on the temperature of the hot mix we will represent the data from Table 2 in relative units. It was found experimentally that the temperature of the hot mix changes most considerably following the distribution along the base depending on the thickness of a layer within 5 to 10 minutes after it has been laid (Table 3).
Table 3
Distribution of the temperature during cooling of the hot mix in time at different air temperatures
|
Time, min |
0 |
5 |
10 |
20 |
30 |
40 |
50 |
60 |
|
|
|
|
|
|
|
|
|
|
|
|
|
|
–10 |
1,27 |
1,13 |
1 |
0,79 |
0,63 |
0,51 |
0,42 |
0,36 |
|
|
|
|
|
|
|
|
|
|
|
°С |
|
0 |
1,25 |
1,12 |
1 |
0,80 |
0,66 |
0,55 |
0,46 |
0,41 |
|
|
|
|
|
|
|
|
|
|
|
|
5 |
1,24 |
1,11 |
1 |
0,81 |
0,67 |
0,57 |
0,49 |
0,43 |
|
temperature, |
|
|||||||||
|
|
|
|
|
|
|
|
|
|
|
|
10 |
1,23 |
1,11 |
1 |
0,82 |
0,68 |
0,58 |
0,51 |
0,45 |
|
|
|
|
|
|
|
|
|
|
|
|
|
20 |
1,21 |
1,10 |
1 |
0,83 |
0,70 |
0,61 |
0,55 |
0,49 |
|
|
|
|
|
|
|
|
|
|
|
|
|
30 |
1,19 |
1,09 |
1 |
0,84 |
0,73 |
0,64 |
0,58 |
0,54 |
|
Air |
|
|||||||||
|
|
|
|
|
|
|
|
|
|
|
|
40 |
1,18 |
1,08 |
1 |
0,86 |
0,75 |
0,68 |
0,62 |
0,57 |
|
|
|
|||||||||
|
|
|
|
|
|
|
|
|
|
|
|
|
50 |
1,16 |
1,07 |
1 |
0,87 |
0,78 |
0,70 |
0,65 |
0,61 |
|
|
|
|
|
|
|
|
|
|
|
66
Issue № 1(29), 2016 |
|
|
ISSN 2075-0811 |
Let us denote the |
obtained coefficient of the effect of the air temperature on the temperature |
||
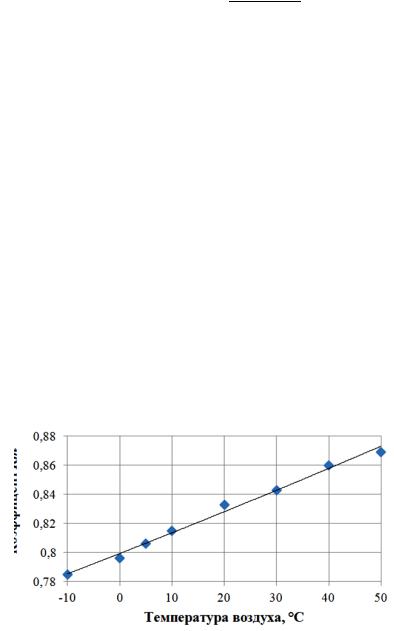
of the hot mix Кв. Fig. 2 sho s the dependence of the coeffici nt of the effect of the air temperatur on the tem perature of the hot mix with its numerical va lues given by
Кт 0,799e0,0018tв , |
(3) |
where т is the co efficient of the effect o f the air te mperature, dimensionl |
ss value; t he corre- |
lation coefficient i 0,99; tв is the temperature of the air, °С. |
|
The ab ove Figure suggests t at as the a ir tempera ure increas es, Кв has more effect, which causes the cooling rate of the hot mix to reduce. It was noted that depending on a type of a mix an bitumen l abel, the te mperature o f making and laying i specified in guideline s. However, de pending o how far a roadway i s, the temperature of an asphalt concrete mi x as it is delivere d on site can be minimum as sp ecified by the guidelines [6, 7]. umerical v alues of the temperature of a mix as it is being c ooled in time depending on the temperatur e as it is delivere d on site is in Table 4.
Coefficient Km
|
|
|
|
|
Air Tempe |
rature, ºС |
|
|
|
|
|
|
||
Fig. 2 . Dependenc |
|
|
|
|
|
|
|
|
|
|
||||
of the coefficient of the ef fect of the air temperature on the temper ature of the hot mix |
||||||||||||||
|
|
|
|
|
|
|
|
|
|
|
|
|
Table 4 |
|
D istribution of |
the temperature of the hot mix in time a t different mix temperature s during layi ng |
|
|
|||||||||||
|
|
|
|
|
|
|
|
|
|
|
|
|
|
|
Time, min |
|
0 |
|
|
|
10 |
|
20 |
30 |
40 |
50 |
|
60 |
|
|
|
|
|
|
|
|
|
|
|
|
|
|
|
|
|
|
180 |
1 2 |
|
147 |
|
120 |
100 |
87 |
77 |
|
69 |
||
|
|
|
|
|
|
|
|
|
|
|
|
|
|
|
Temperature of a mix during |
160 |
1 4 |
|
131 |
|
107 |
90 |
78 |
70 |
|
63 |
|||
|
|
|
|
|
|
|
|
|
|
|
|
|
||
140 |
1 6 |
|
115 |
|
95 |
80 |
70 |
63 |
|
57 |
||||
laying, 0С |
|
|
|
|
||||||||||
|
|
|
|
|
|
|
|
|
|
|
|
|
|
|
|
120 |
1 9 |
|
99 |
|
82 |
70 |
62 |
55 |
|
51 |
|||
|
|
|
|
|
||||||||||
|
|
|
|
|
|
|
|
|
|
|
|
|
|
|
|
|
100 |
91 |
|
83 |
|
70 |
60 |
53 |
48 |
|
44 |
||
|
|
|
|
|
|
|
|
|
|
|
|
|
|
|
67
Scientific Herald of t he Voronezh State University o f Architecture and Civil Engineering. Construction and Architecture
In orde to identify the general law of th |
effect of the temperature of a mix delivered on site, |
let us i ntroduce the coefficie t Ксм allo |
ing for th temperature of the hot mix as it is deli- |
vered on site and p resent num erical values of the temperature in relative u nits. Let us assume
the temperature of the mix as it is delivered to be 160 0С per unit. The tem peratures of |
the mix |
||||||||||||
in relative units are identified in Table 5. |
|
|
|
|
|
|
|
||||||
|
|
|
|
|
|
|
|
|
|
|
|
Table 5 |
|
Distribution of the temperature of the hot mix in time |
t different te mperatures of the mix durin g |
||||||||||||
|
|
|
|
(in relative units) |
|
|
|
|
|
|
|||
|
|
|
|
|
|
|
|
|
|
|
|
|
|
Time, min |
|
0 |
5 |
|
10 |
|
20 |
30 |
40 |
50 |
60 |
|
Ʃ |
|
|
|
|
|
|
|
|
|
|
|
|
|
|
|
180 |
1,13 |
1,122 |
|
1,118 |
|
1 ,112 |
1,107 |
1,108 |
1,04 |
1,1 |
|
1,12 |
|
|
|
|
|
|
|
|
|
|
|
|
|
|
Tempera ture of a mix |
160 |
1 |
1 |
|
1 |
|
1 |
1 |
1 |
1 |
1 |
|
1,0 |
|
|
|
|
|
|
|
|
|
|
|
|
|
|
140 |
0,87 |
0,87 |
|
0,88 |
|
0,88 |
0,8 |
0,89 |
0,90 |
0,9 |
|
0,87 |
|
during laying, 0С |
|
|
|
||||||||||
|
|
|
|
|
|
|
|
|
|
|
|
|
|
120 |
0,75 |
0,75 |
|
0,76 |
|
0 0,77 |
0,7 |
0,78 |
0,80 |
0,8 |
|
0,75 |
|
|
|
|
|
||||||||||
|
|
|
|
|
|
|
|
|
|
|
|
|
|
|
100 |
0,63 |
0,63 |
|
0,64 |
|
0,65 |
0,6 |
0,64 |
0,65 |
0,6 5 |
|
0,62 |
|
|
|
|
|
|
|
|
|
|
|
|
|
|
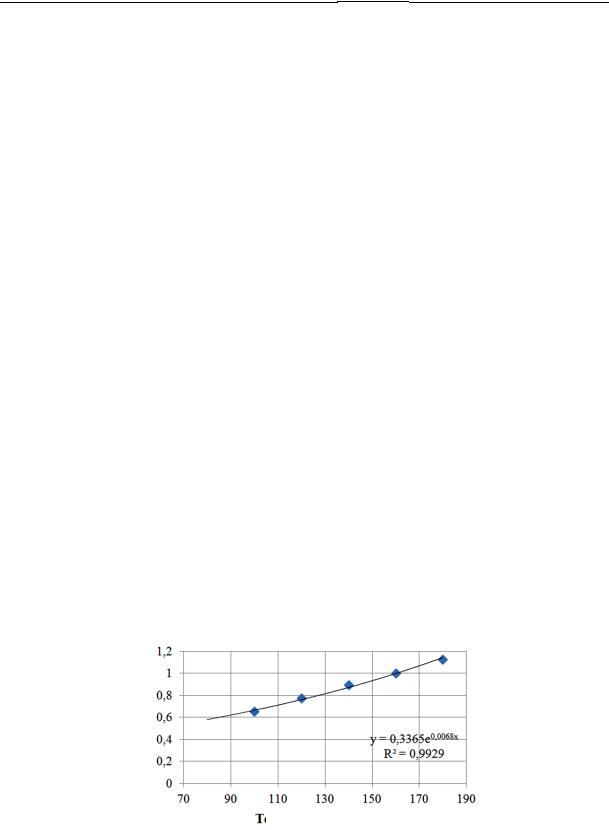
The ab ve data su ggests that regardless of the temperature of the mix deli vered on site, there is a gen eral law of cooling of the mix in time whic h can be accounted for by introdu cing the coefficient Ксм which is in Fig. 3. The numerical v lue of the coefficient Ксм is given by the followi ng
см 0,336e0,0068tсм , |
(4) |
where tсм is the tem perature o f the mix d ring laying; the correlation coefficient is 0,99.
KmCoefficient
 Temperature of the mix, ºС
Fig. 3. Dependence o f Ксм on the temperature o the mix as it is being distributed along a roadway ba e course
As asp |
alt concrete mixes ar e used, the cooling rate and thus the constru ction times depend |
on the |
wind speed. Current gu idelines specify restri tions on co nstruction times depe nding on |
68
Issue № 1(29), 2016 |
ISSN 2075-0811 |
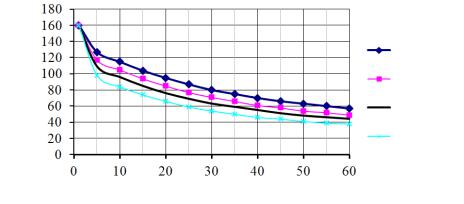
the air temperature and the wind speed [8]. As the air temperature drops, current guidelines certify that the hot asphalt mix is paved onto the base course provided that the wind speed is not over than that as specified in Table 6 [6]. These restrictions depending on the wind speed are due to intensive heat transfer into the environment as the hot mix is distributed in a small layer on a large surfacing area which causes the cooling rate to increase and construction times to increase. The heat transfer coefficient is found to depend on the wind speed [9]. As a result of modeling of thermal processes in asphalt concrete mixes, the wind speed was found to influence the cooling rate of the mix considerably. Fig. 4 shows the cooling rate at different wind speeds and Table 6 –– the temperatures depending on time.
Temperature, ºС
0 m/sec 2–4 m/sec 3–8 m/sec 4–15 m/sec
Time, min
Fig. 4. Effect of the wind speed on the cooling rate of an asphalt concrete mix
Table 6
Change in the temperature of the hot mix in time at different wind speeds
Time, min |
|
0 |
5 |
10 |
20 |
30 |
40 |
50 |
60 |
|
|
|
|
|
|
|
|
|
|
|
0 |
160 |
127 |
115 |
95 |
80 |
70 |
63 |
57 |
|
|
|
|
|
|
|
|
|
|
|
2 |
160 |
122 |
110 |
89 |
75 |
65 |
58 |
53 |
|
|
|
|
|
|
|
|
|
|
|
4 |
160 |
117 |
105 |
85 |
71 |
61 |
54 |
49 |
Wind speed, m/sec |
|
|
|
|
|
|
|
|
|
6 |
160 |
113 |
100 |
80 |
67 |
58 |
51 |
46 |
|
|
|
|
|
|
|
|
|
|
|
|
8 |
160 |
109 |
96 |
76 |
63 |
55 |
48 |
44 |
|
|
|
|
|
|
|
|
|
|
|
10 |
160 |
106 |
92 |
73 |
60 |
52 |
46 |
42 |
|
|
|
|
|
|
|
|
|
|
|
15 |
160 |
98 |
84 |
66 |
54 |
46 |
41 |
38 |
|
|
|
|
|
|
|
|
|
|
In order to specify the effect of the wind speed on cooling of the hot asphalt concrete mix, let us introduce Table 6 in relative units (Table 7).
69
Scientific Herald of t he Voronezh State University o f Architecture and Civil Engineering. Construction and Architecture
|
|
|
|
|
|
|
|
|
|
|
|
|
|
Table 7 |
|
Ch ange in the te mperature of the hot mix i n time at different wind speeds |
|
|
|||||||||||
|
|
|
|
|
(in relative units) |
|
|
|
|
|
|
|||
|
|
|
|
|
|
|
|
|
|
|
|
|
|
|
ime, min |
|
|
0 |
5 |
10 |
20 |
|
30 |
40 |
50 |
|
60 |
Ʃ |
|
|
|
|
|
|
|
|
|
|
|
|
|
|
|
|
|
|
0 |
1 |
1 |
|
1 |
1 |
|
1 |
1 |
1 |
|
1 |
1 |
|
|
|
|
|
|
|
|
|
|
|
|
|
|
|
|
|
2 |
1 |
0,96 |
0, |
96 |
0,94 |
|
0,94 |
0 ,93 |
0,92 |
|
0,93 |
0,936 |
|
|
|
|
|
|
|
|
|
|
|
|
|
|
|
|
|
4 |
1 |
0,92 |
0, |
91 |
0,89 |
|
0,89 |
0 ,87 |
0,86 |
|
0,86 |
0,885 |
Wind speed, m/sec |
|
|
|
|
|
|
|
|
|
|
|
|
|
|
|
6 |
1 |
0,89 |
0,87 |
0,85 |
|
0,84 |
0 ,83 |
0,81 |
|
0,81 |
0,84 |
||
|
|
|
|
|
|
|
|
|
|
|
|
|
|
|
|
|
8 |
1 |
0,86 |
0,83 |
0,8 |
|
0,79 |
0 ,79 |
0,76 |
|
0,77 |
0,795 |
|
|
|
|
|
|
|
|
|
|
|
|
|
|
|
|
|
|
10 |
1 |
0,83 |
0 |
,8 |
0,77 |
|
075 |
0 ,74 |
0,73 |
|
0,74 |
0,76 |
|
|
|
|
|
|
|
|
|
|
|
|
|
|
|
|
|
15 |
1 |
0,77 |
0, |
73 |
0,69 |
|
0,68 |
0 ,66 |
0,65 |
|
0,67 |
0,685 |
|
|
|
|
|
|
|
|
|
|
|
|
|
|
|
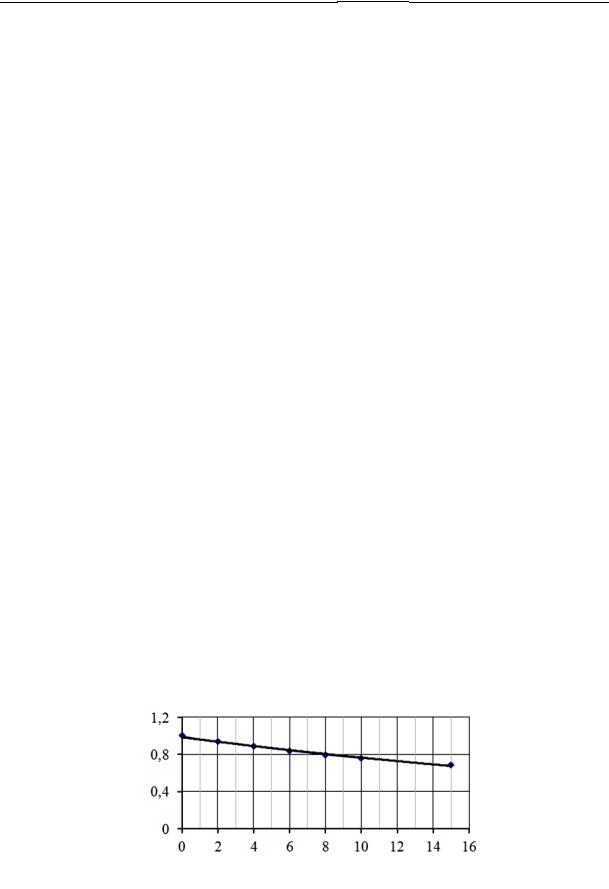
The ab ve data su ggests that the wind sp eed influen ces the co ling rate of the hot mix and it increase s as does t he air mass displacement. Cooling complies ith an exp onential dep endence and is g eneral. Ta ing into account the temperature of the mix at the zero speed per unit, we obtain the depende nce of the w ind speed o n the cooli ng of the asphalt concr te mix (Fig. 5).
The nu merical val e of the coefficient is given by the equation
K |
0,984e 0,025v , |
(5) |
v |
|
|
where v is the win speed, m/ seс; the correlation coe fficient is 0 ,99.
Consid ring the specified stru cture of a oadway surfacing, the thickness of a layer can vary. According to the guidelines, a minimum thickness for the upper layer of a surfacing is 0,03 m and for the lower layer 0,08 [13]. Thus the cooli ng rate of t he hot mix and thereb y paving times a re different. Fig. 6 shows the dist ribution of the temper ture of the hot mix de pending on the thickness of a paved la yer at the mix tempera ure during laying 160 0С.
Coefficient Кv
Wind speed, /sec
Fig. 5. Co fficient Кv allowing for th effect of the wind speed
70