Материал: part17

Внимание! Если размещение файла нарушает Ваши авторские права, то обязательно сообщите нам

Page 416​

DICOM PS3.17 2020a - Explanatory Information​

- Standard -​

DICOM PS3.17 2020a - Explanatory Information​

Page 417​

TT Stress Testing Report Template​ (Informative)​

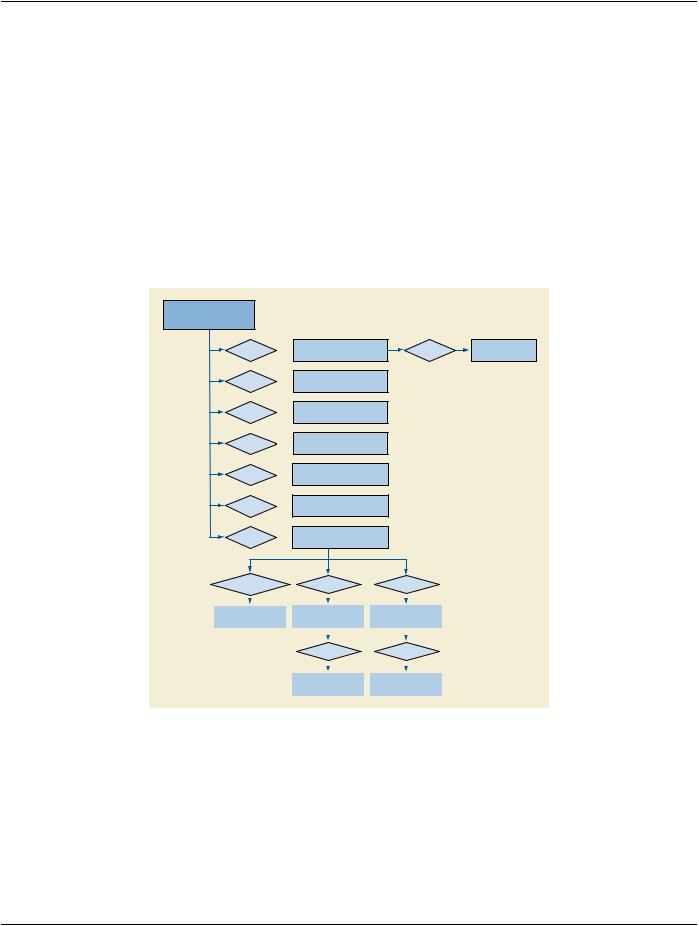
The Stress Testing Report is based on TID 3300 “Stress Testing Report”. The first part of the report contains sections (containers)​ describing the patient characteristics (height, weight, etc.), medical history, and presentation at the time of the exam.​

The next part describes the technical aspects of the exam. It includes zero or more findings containers, each corresponding to a​ phase of the stress testing procedure. Within each container may be one or more sub-containers, each associated with a single​ measurement set. A measurement set consists of measurements at a single point in time. There are measurement sets defined for​ both stress monitoring and for imaging.​

The final part of the report includes a summary of significant findings or measurements, and any conclusions or recommendations​

The resulting hierarchical structure is depicted in Figure TT-1.​

ROOT

Stress Testing Measurements (CONTAINER)

1 CONTAINS

0..1 CONTAINS

1 CONTAINS

0..1 CONTAINS

0..1 CONTAINS

0..1 CONTAINS

1 - N CONTAINS

TID 3602

Patient Characteristics (CONTAINER)

TID 3802

Patient History (CONTAINER)

Test Conditions

(CONTAINER)

Procedure Summary

(CONTAINER)

Comparison to Prior Study (CONTAINER)

Conclusions and Recommendations

(CONTAINER)

Temporal Phase Findings

(CONTAINER)

CONTAINS

Obervations

NUM, TEXT

HAS CONCEPT MOD

CONTAINS

CONTAINS


1 - N


1 - N


Phase


Stress Monitoring


Imaging


Measurements Group


Measurement Group

CODE


(CONTAINER)


(CONTAINER)


CONTAINS

CONTAINS


1 - N


1 - N


Obervations


Obervations


NUM, TEXT, CODE


NUM, TEXT, CODE


Figure TT-1. Stress Testing Report Template​

- Standard -​

Page 418​

DICOM PS3.17 2020a - Explanatory Information​

- Standard -​

DICOM PS3.17 2020a - Explanatory Information​

Page 419​

UU Macular Grid Thickness and Volume​

Report Use Cases (Informative)​

UU.1 Introduction​

Ophthalmologists use OPT data to diagnose and characterize tissues and abnormalities in transverse and axial locations within the​ eye. For example, an ophthalmologist might request an OPT of the macula, the optic nerve or the cornea in either or both eyes for a​ given patient. Serial reports can be compared to monitor disease progression and response to treatment. OPT devices produce two​ categories of clinical data: B-scan images and tissue measurements.​

UU.2 Use of B-scan Images​

Prior to interpreting an OPT B-scan (or set of B-scans), users must first determine if the study is of adequate quality to answer the​ diagnostic question. Examples of inadequate studies include:​

•​The pathology that needs to be visualized does not appear within the field of the scan.​

•​The image quality is not sufficient to see the tissue layers of interest (i.e., media opacity, blink, etc).​

•​The scans are not in the expected anatomic order (i.e., due to eye movements).​

Insomecases,inadequateimagescanbecorrectedbycapturinganotherscaninthesamearea.However,inothercases,thepatient's​ eye disease interferes with visualization of the tissues of interest making adequate image quality impossible. Ideally, when choosing​ between multiple scans of the same tissue area, physicians would have access to information about the above questions so they can​ select only the best scan(s).​

The physician may then choose to view and assess each B-scan in the data individually. When assessing OPT B-scans, ophthalmo-​ logists often identify normal or expected tissue boundaries first, then proceed to identify abnormal interfaces or structures next. The​ identification of pathology is both qualitative (i.e., does a structure exist) and quantitative (i.e., how thick is it). If previous scans are​ present for this patient, the physician may choose to compare the most recent scan data with prior visits. Due to workflow constraints,​ it may be difficult for B-scan interpretations to happen on the same machine that captures the images. Therefore, remote image as-​ sessment, such as image viewing in the examining room with the patient, is optimal.​

UU.3 Use of Tissue Measurements​

In addition to viewing B-scan image data, clinicians also use quantitative measurements of tissue thicknesses or volumes extracted​ automatically from the OPT images. As with image quality, the accuracy of automated segmentation must be assessed prior to use​ of the numerical measurements based on these boundaries. This is typically accomplished by visual inspection of boundary lines​ placed on the OPT images but also can be inferred from analysis confidence measurements provided by the device software. In ad-​ dition to segmentation accuracy, it is also important to determine if the region of interest has been aligned appropriately with the in-​ tended sampling area of the OPT.​

The analysis software application segments OPT images using the raw data of the instrument to quantify tissue optical reflectivity​ and location in longitudinal scan or B-scan images. Many boundaries can be identified automatically with software algorithms, see​ Figure UU.3-1.​

- Standard -​

Page 420​

DICOM PS3.17 2020a - Explanatory Information​

Figure UU.3-1. OPT B-scan with Layers and Boundaries Identified​

UU.4 Axial Measurements​

The innermost (anterior) layer of the retina, the internal limiting membrane (ILM) is often intensely hyperreflective and defines the in-​ nermost border of the nerve fiber layer. The nerve fiber layer (NFL) is bounded posteriorly by the ganglion cell layer and is not visible​ within the central foveal area. In high quality OPT scans, the sublamina of the inner plexiform layer may be identifiable. The external​ limiting membrane is the subtle interface between the outer nuclear layer and the photoreceptors. The junction between the​ photoreceptorinnersegmentsandoutersegments(IS/OSjunction)isoftenintenselyhyperreflectiveandintimedomainOPTsystems,​ was thought to represent the outermost boundary of the retina. Current thought, however, suggests that the photoreceptors extend​ up to the next bright interface, often referred to as the retinal pigment epithelium (RPE) interdigitation. This interface may be more​ than 35 micrometers beyond the IS/OS junction. When three high intensity lines are not present under the retina, however, this inter-​ digitation area may not be visible. The next bright region typically represents the RPE cell bodies, which consist of a single layer of​ cuboidal cells with reflective melanosomes oriented at the innermost portion of the cells. Below the RPE cells is a structure called​ Bruch's membrane, which is contiguous with the outer RPE cell membrane.​

The axial thickness and volume of tissue layers can be measured using the boundaries defined above. For example, the nerve fiber​ layer is typically measured from the innermost ILM interface to the interface of the NFL with the retina. Time domain OPT systems​ measure retinal thickness as the axial distance between the innermost ILM interface and the IS/OS junction. However, high resolution​ OPTsystemsnowofferthepotentialtomeasuretrueretinalthickness(ILMtooutermostphotoreceptorinterface)inadditiontovariants​ that include tissue and fluid that may intervene between the retina and the RPE. The RPE layer is measured from the innermost​ portion of the RPE cells, which is the hyper reflective melanin-containing layer to the outermost highly reflective interface. Pathologic​ structuresthatmayintervenebetweennormaltissuelayersmayobscuretheirappearancebutoftencanbemeasuredusingthesame​ methods as normal anatomic layers.​

UU.5 En Face Measurements​

The macular grid is based upon the grid employed by the Early Treatment of Diabetic Retinopathy Study (ETDRS) to measure area​ and proximity of macular edema to the anatomic center of the macula, also called the fovea. This grid was developed as an overlay​ forusewith32mmfilmcolortransparenciesandfluoresceinangiogramsintheseminaltrialsoflaserphotocoagulationforthetreatment​ of diabetic retinopathy. Subsequently, this grid has been in common use at reading centers since the 1970s, has been incorporated​ into ophthalmic camera digital software, and has been employed in grading other macular disease in addition to diabetic retinopathy.​ This grid was slightly modified for use in Time Domain OPT models developed in the 1990s and early 2000s in that the dimensions​ of the grid were sized to accommodate a 6 mm diameter sampling area of the macula.​

The grid for macular OPT is bounded by circular area with a diameter of 6 mm. The center point of the grid is the center of the circle.​ The grid is divided into 9 standard subfields. The center subfield is a circle with a diameter of 1 mm. The grid is divided into 4 inner​ and 4 outer subfields by a circle concentric to the center with a diameter of 3 mm. The inner and outer subfields are each divided by​ 4 radial lines extending from the center circle to the outermost circle, at 45, 135, 225, and 315 degrees, transecting the 3 mm circle​ in four places. Each of the 4 inner and 4 outer subfields is labeled by its orientation with regard to position relative to the center of the​ macula - superior, nasal, inferior, and temporal. For instance, the superior inner subfield is the region bounded by the center circle​ andthe3mmcirclethe315degreeradialline,andthe45degreeradialline.Thenasalsubfieldsarethoseorientedtowardthemidline​ of the patient's face, nearest to the optic nerve head. The grids for the left and right eyes are reversed with respect to the positions​ of the nasal and temporal subfields - in viewing the grid for the left eye along the antero-posterior (Z) axis, the nasal subfields are on​

- Standard -​

Источник: https://studfile.net/preview/14585770/