Материал: Russian Journal of Building Construction and Architecture
Russian Journal of Building Construction and Architecture
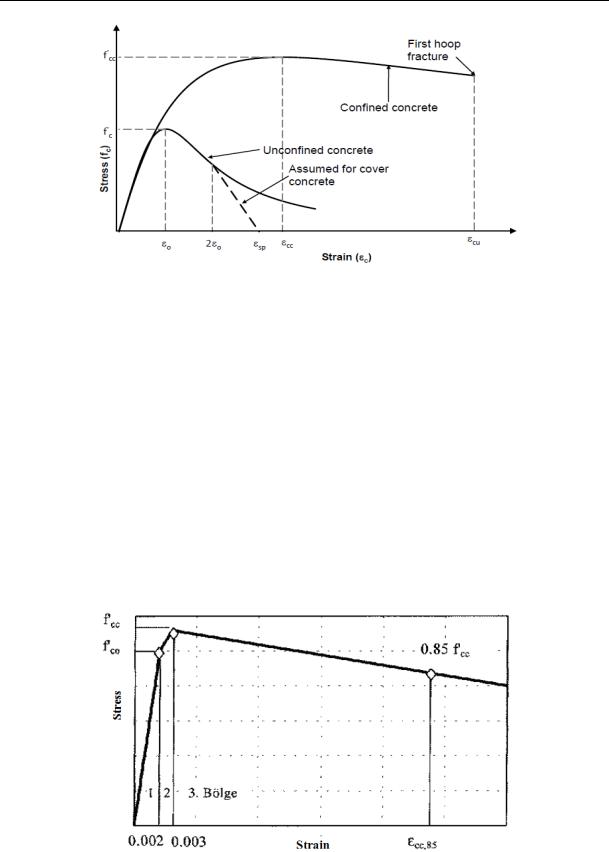
Fig. 4. Stress-strain relation for confined and confined concrete –Mander et al (1988) [13]
Trilinear Concrete Model
This is a simplified uniaxial trilinear concrete model that assumes no resistance to tension and features a residual strength plateau. It has calibration variation related to five different mechanical feature of concrete, such as compressive strength (fc1), initial rigidity (E1), post-peak rigidity (E2), residual (final) strength (fc2) and specific weight [10].
In this model, behavior is examined in three different areas. The first area is defined as a line until the 0.002 axial strain and in 0.002 axial shortening, the confined concrete stress is deemed equal to the non-confined element concrete strength [3]. Stress-strain graph for this model was given at Fig. 5.
Fig. 5. Stress –– strain relation for a trilinear stress-strain model [3]
96
Issue № 4 (36), 2017 |
ISSN 2542-0526 |
Chang-Mander Nonlinear Concrete Model
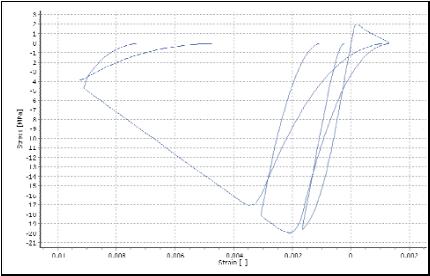
It is a model developed by Chang and Mander (1994) [4]. This concrete model, compared to other models featuring sudden changes in section models due to sudden fracture closing, especially prioritizes the transitions in stress-strain behaviors during fracture opening/closing. Concrete behavior under tensile, like it is under pressure, is repetitive and the model’s pressure and tensile envelopes control the slope of the stress-strain behavior at the origin as well as the increasing and decreasing parts of the same behavior (eg. pre-peak and post-peak parts). This model features eight parameters. These are; compressive strength (fc), tensile strength (ft), modulus of elasticity (Es), shortening per unit under greatest pressure, elongation per unit under greatest tensile stress, non-dimensional critical pressure shortening (Xcr-), nondimensional critical tensile elongation (Xcr +) and specific weight [10]. The graph of stressstrain for this model was given at Fig. 6.
Fig. 6. Stressstrain relation for ChangMander model [10]
Kappos ve Konstantinidis Nonlinear Concrete Model
It is an uniaxial, non-linear model with fixed effect of confinement, developed and programmed by Kappos and Konstantinidis (1999) [5]. It uses the constitutive relationship suggested bt Nagashima et al. (1992) [14] and its statistical calibration is made according to a very wide spectrum of experimental data. The effect of confinement provided by transverse confinement is treated by modified Sheikh and Uzumeri (1982) [15] factor (effect of confinement coefficient) and the existence of a fixed effect of confinement throughout the entire stress-strain definition range. In order to define this model, concrete compressive strength (fc),
97
Russian Journal of Building Construction and Architecture
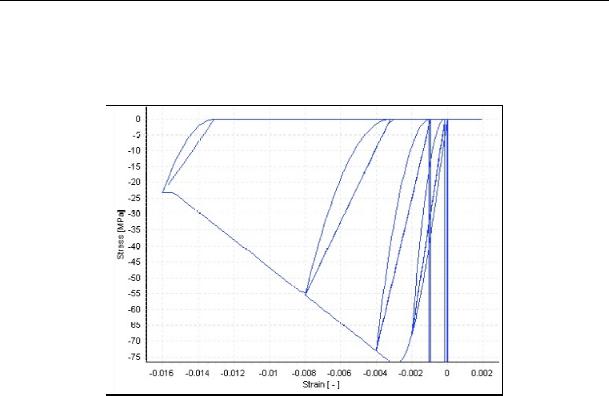
tensile strength (ft), modulus of elasticity and specific weight parameters are required [10]. Fig. 7 gives stress-strain graphs for this model.
Fig. 7. Stressstrain relation for KapposKonstandtinidis model [10]
PerformanceBased Assessment
The importance of studies, researches and prevention about earthquake have risen after destructive earthquakes over the world especially in recent years. Earthquake damages will increase according to vulnerability of urban and rural building stocks. The size of earthquakes and the negative structural features will occur due to an increase in damage amount. Knowing the properties of buildings that have been negatively influenced in the seismic behavior of buildings under earthquakes will be put forward to ensure more serious approaches to reduce the level of damage risk as following earthquakes. In order to reduce the damages of the earthquakes, firstly the performance of buildings needs to be determined.
Earthquake safety of existing buildings has gained considerable importance after earthquakes which have occurred in our country especially in the last 30 years. Performance based assessment methods have been widely used in existing reinforced concrete structures.
In performance based design and assessment method, it is possible to determine in quantities the damage levels that may arise under the design ground motion within the structural system elements. It is checked whether this damage stays under the acceptable damage levels for each related element. Acceptable damage limits are defined in a way to be consistent with the foreseen performance targets at various earthquake levels [16, 17, 18].
98
Issue № 4 (36), 2017 |
ISSN 2542-0526 |
The assessment procedure aims to estimate the earthquake force demand at which the building would sustain the performance objectives. Demand spectrum, which is used in determining the performance of the building’s system, shows the maximum response that a building gives against seismic activities during an earthquake [19].
Two fundamental parameters of performance based design and assessment are earthquake demand and capacity [20, 21]. Earthquake demand represents the earthquake ground movement, whereas capacity represents building’s reaction under the effect of an earthquake. Structural capacity is represented by static pushover and capacity curve. This curve is derived by drawing the function between base shear force and building’s roof displacement. Capacity curve is derived with the calculation of building system with gravitational loads and proportionately increasing lateral forces up to the target point where structural capacity ends. The actual purpose of the nonlinear static method is to determine the target displacement of a building, then performing a final pushover analysis comes by increasing the lateral loads up to the target displacement. As a result, the demand values such as internal forces, rotations, strains and displacements are computed and the performance of the analyzed section is then evaluated with comparison of the strains obtained from the total curvature of the section with the upper boundary strains designated for different cross-sectional performance levels [22].
Based on structural dynamics theory, the modal pushover analysis procedure retains the conceptual simplicity of current procedures with invariant force distribution, and it is now common in structural engineering practice [23]. The POA has been widely used for its conceptual simplicity, computational attractiveness and capability of providing satisfactory predictions of seismic demands for low and medium-rise structures if the inelastic action is distributed over the height of the structures [24]. The pushover should be continued to the largest displacement practicable until the degradation of overall system occurs or limits of structural stability occur. In cases where a target displacement is set as a goal, it is generally worthwhile to push a little further to establish a better confidence level [25].
Building Example and Analysis Results
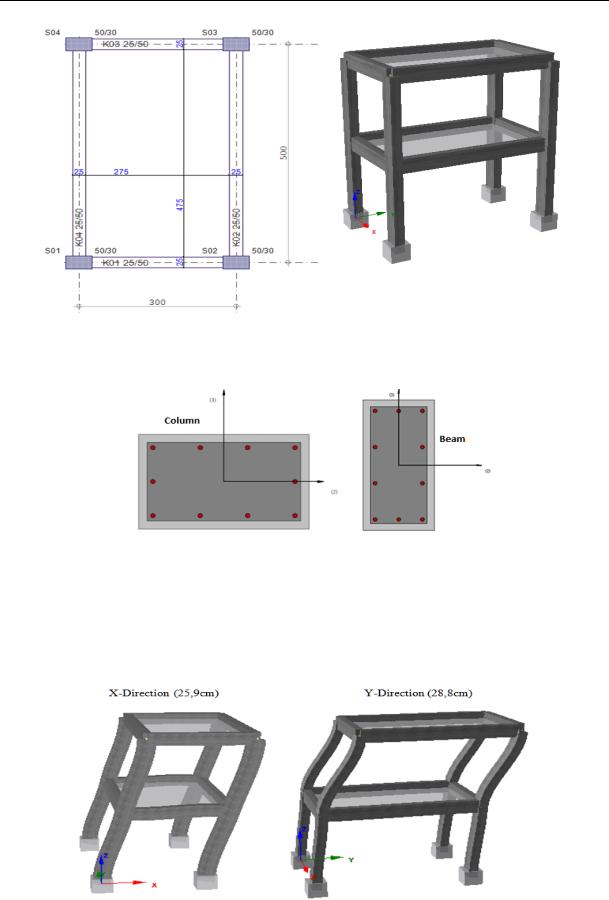
The reinforced concrete structure which is selected as an example has got 2 storeys, and the height of storey is 3 m for each storey. The material used in the structure is C30-S420. The reinforcements used in the beams and columns were selected as 14. The plan and 3D model of the structure is given at Fig. 8.
Columns were selected as 30*50cm, and beams were selected as 25×50cm. The transverse reinforcements (stirrups) which were used in both elements were selected as ϕ10/10. The columns and beams used in the structure are shown at Fig. 9.
99
Russian Journal of Building Construction and Architecture
Fig. 8. The blueprint and 3-D model of the building
Figure 9. The column and beam that used in this study
Maximum displacement values and deformation statuses which were calculated for the X and Y directions for each concrete model are given in Fig. 10.
Fig. 10 a. Deformation of building in both directions for Mander et al Nonlinear Concrete Model
100