DICOM PS3.17 2020a - Explanatory Information |
Page 633 |
NNN Corneal Topography and Tomography
Maps (Informative)
NNN.1 Introduction
Several ophthalmic devices produce curvature and/or elevation measurements of corneal anterior and posterior surfaces (e.g., maps that display corneal curvatures, corneal elevations, and corneal power, etc.). The principle methods used include reflection of light from the corneal surface (e.g., Placido ring topography) and multiple optical sectioning or slit beam imaging (e.g., Scheimpflug tomography). The measurements are mapped topographically as pseudo-color maps, and used extensively for diagnostic purposes by clinicians and to fit contact lenses in difficult cases. The underlying data from these measurements is also used to guide laser sculpting in keratorefractive surgery.
NNN.2 Corneal Topography Scales and Color Palettes
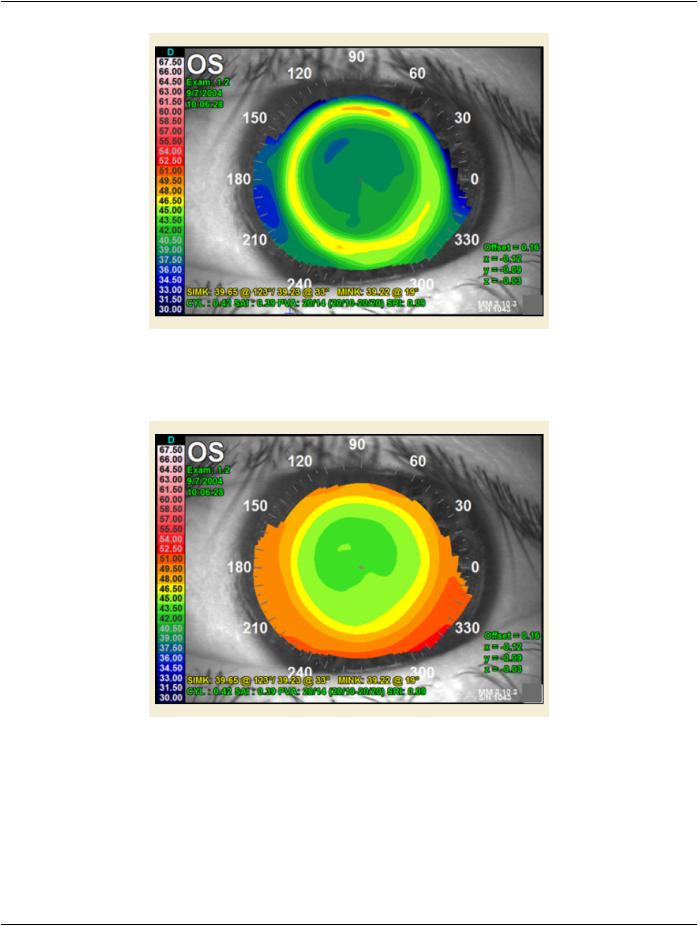
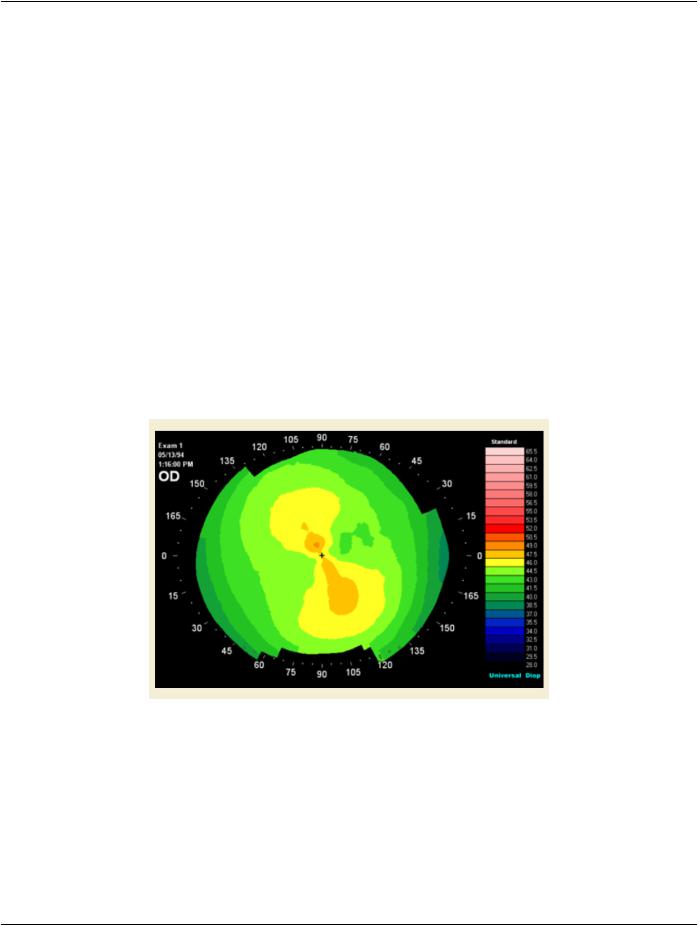
The method for presenting corneal topography maps with pseudo-colored images has been studied extensively. Contour maps are effective for diagnostic purposes. The proper scaling is important so that clinically important detail is not obscured as well irrelevant detail masked. This can be done with a scale that has fixed dioptric intervals. The choice of color palette to represent different levels of corneal power is equally important. There must be enough contrast between adjacent contour colors to provide pattern recognition; it is the corneal topography pattern that is used for clinical interpretation. A color palette can be chosen so that lower corneal powers are represented with cooler colors (blue shades), while higher corneal powers are represented with the warmer colors (red shades). Green shades are used to represent corneal powers associated with normal corneas. The standard scale is shown in Figure NNN.2- 1.
Figure NNN.2-1. Scale and Color Palette for Corneal Topography Maps
NNN.3 Corneal Topography Examples
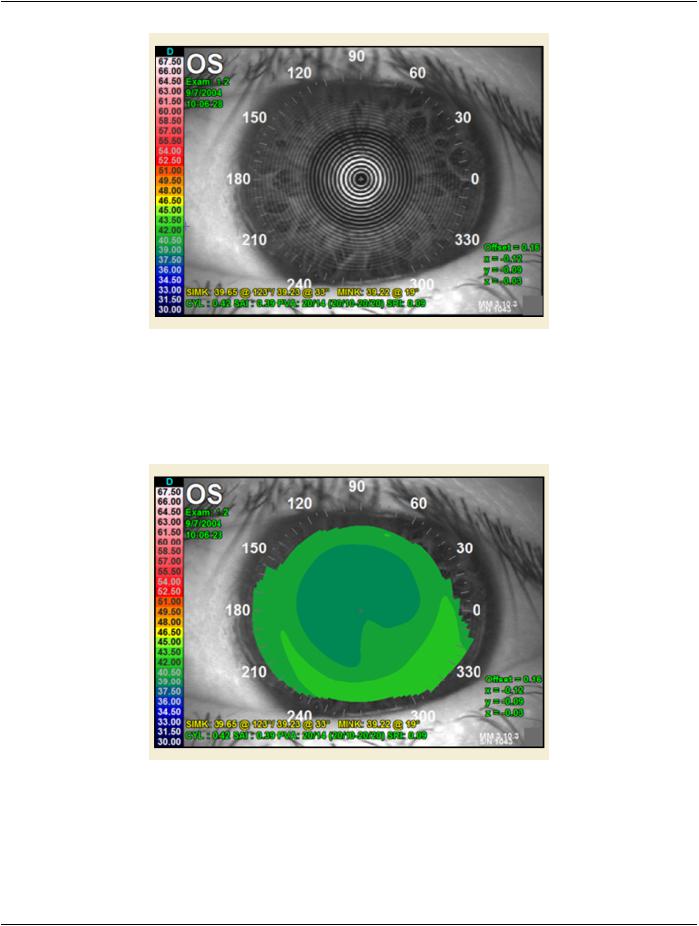
Quantitative measurements of anterior corneal surface curvature (corneal topography) are made with the Placido ring approach. Patterns on an illuminated target take the form of mires or a grid pattern. Their reflection from the anterior corneal surface tear film, shown in Figure NNN.3-1, is captured with a video camera. Their positions relative to the instrument axis are determined through image analysis and these data are used to calculate anterior corneal curvature distribution.