Материал: part17

Внимание! Если размещение файла нарушает Ваши авторские права, то обязательно сообщите нам

Page 676​

DICOM PS3.17 2020a - Explanatory Information​


Node​

CodeMeaningofConceptName​ Code Meaning or Example Value​

TID​

1.5.1.1​

Tracking Identifier​

Object1 (same for both Measurement​

TID 1411​


Groups)​


1.5.1.2​

Tracking Unique Identifier​

1.2.276.0.7230010... (same for both​

TID 1411​


Measurement Groups)​


1.5.1.3​

Referenced Segment​

IMAGE - Segmentation, Segment #1​

TID 1411​

1.5.1.4​

Source image for segmentation​

IMAGE - CT image #1​

TID 1411​

1.5.1.5​

Source image for segmentation​

IMAGE - CT image #2​

TID 1411​

1.5.1.6​

Finding Site​

AdrenalGland(sameforbothMeasurement​TID 1419​


Groups)​


1.5.1.6.1​

Laterality​

Right(sameforbothMeasurementGroups)​TID 1419​

1.5.1.7​

Volume​

3267.46 mm3​

TID 1419​

1.5.1.7.1​

Measurement Method​

Sum of segmented voxel volumes​

TID 1419​


CID 7474​

1.5.1.8​

Attenuation Coefficient​

70.978 Hounsfield unit​

TID 1419​

1.5.1.8.1​

Derivation​

Mean​

TID 1419​


CID 7464​

1.6.1​

Measurement Group​


TID 1501​

1.6.1.1​

Tracking Identifier​

Object1 (same for both Measurement​

TID 1501​


Groups)​


1.6.1.2​

Tracking Unique Identifier​

1.2.276.0.7230010... (same for both​

TID 1501​


Measurement Groups)​


1.6.1.3​

Finding Site​

AdrenalGland(sameforbothMeasurement​TID 1501​


Groups)​


1.6.1.3.1​

Laterality​

Right(sameforbothMeasurementGroups)​TID 1501​

1.6.1.4​

Long Axis​

9.21 mm​

TID 300​


CID 7470​

1.6.1.4.1​

Measurement Method​

RECIST 1.1​

TID 300​


CID 6147​

1.6.1.4.2​

Source of Measurement​

SCOORDGraphicTypePOLYLINEwithtwo​TID 320​


coordinates, the beginning and end of a line​


segment​

CID 7470​

1.6.1.4.2.1​

(none)​

IMAGE - CT image #1​

TID 320​

1.6.1.5​

Short Axis​

6.8 mm​

TID 300​


CID 7470​

1.6.1.5.1​

Measurement Method​

WHO​

TID 300​


CID 6147​

1.6.1.5.2​

Source of Measurement​

SCOORDGraphicTypePOLYLINEwithtwo​TID 320​


coordinates, the beginning and end of a line​


segment​

CID 7470​

1.6.1.5.2.1​

(none)​

IMAGE - CT image #1​

TID 320​

- Standard -​

DICOM PS3.17 2020a - Explanatory Information​

Page 677​

SSSUseofImageLibrariesinSRDocuments​ (Informative)​

This Annex contains examples of the use of Image Library templates within SR Documents.​

SSS.1 Image Library for PET-CT Example​

This PET-CT example dillustrates an Image Library in which Attributes of images for two modalities are described, with common At-​ tributes factored out of the individual image references.​

Note​

1.​OnlytheAttributesofrelevancetoSUVandspatialmeasurementsareincluded,notacompletedescriptionofallaspects​ of acquisition.​

2.​Only two images for each modality are described, rather than all slices acquired, since it is usually only necessary to​ describe images that are referenced elsewhere in the SR content tree, e.g., on which a region of interest is specified​ from which measurements are made.​

Table SSS.1-1. Image Library for PET-CT Example​

Node​

Code Meaning of Concept Name​

CodeMeaningorExample​

TID​


Value​


1.n​

Image Library​


TID 1600​


1.n.1​

Image Library Group​


TID 1600​


1.n.1.1​

Modality​

PET​

TID 1602​


1.n.1.2​

Target Region​

Whole Body​

TID 1602​


1.n.1.3​

Study Date​

20030417​

TID 1602​


1.n.1.4​

Acquisition Date​

20030417​

TID 1602​


1.n.1.5​

Acquisition Time​

094513​

TID 1602​


1.n.1.6​

Frame of Reference UID​

1.2.3.xyz​

TID 1602​


1.n.1.7​

Pixel Data Rows​

128​

TID 1602​


1.n.1.8​

Pixel Data Columns​

128​

TID 1602​


1.n.1.9​

Horizontal Pixel Spacing​

4.0 mm​

TID 1604​


1.n.1.10​

Vertical Pixel Spacing​

4.0 mm​

TID 1604​


1.n.1.11​

Spacing Between Slices​

4.0 mm​

TID 1604​


1.n.1.12​

Slice Thickness​

4.0 mm​

TID 1604​


1.n.1.13​

Image Orientation (Patient) Row X​

1​

TID 1604​


1.n.1.14​

Image Orientation (Patient) Row Y​

0​

TID 1604​


1.n.1.15​

Image Orientation (Patient) Row Z​

0​

TID 1604​


1.n.1.16​

Image Orientation (Patient) Column X​

0​

TID 1604​


1.n.1.17​

Image Orientation (Patient) Column Y​

1​

TID 1604​


1.n.1.18​

Image Orientation (Patient) Column Z​

0​

TID 1604​


1.n.1.19​

Radionuclide​

^18^Fluorine​

TID 1607​


1.n.1.20​

Radiopharmaceutical agent​

Fluorodeoxyglucose F^18^​TID 1607​


1.n.1.21​

Radiopharmaceutical Start DateTime​

20030417084513​

TID 1607​


1.n.1.22​

Radionuclide Total Dose​

277000000 Bq​

TID 1607​


- Standard -​

Page 678​

DICOM PS3.17 2020a - Explanatory Information​


Node​

Code Meaning of Concept Name​

CodeMeaningorExample​

TID​


Value​


1.n.1.23​

PET Radionuclide Incubation Time​

60 min​

TID 1607​


1.n.1.24​

Glucose​

5.5 mmol/l​

TID 1607​


1.n.1.24.1​

Glucose Measurement Date​

20030417​

TID 1607​


1.n.1.24.2​

Glucose Measurement Time​

083043​

TID 1607​


1.n.1.25​


IMAGE - PET image #1​

TID 1601​


1.n.1.25.1​

Image Position (Patient) X​

-288.0​

TID 1604​


1.n.1.25.2​

Image Position (Patient) Y​

288.0​

TID 1604​


1.n.1.25.3​

Image Position (Patient) Z​

136.0​

TID 1604​


1.n.1.26​


IMAGE - PET image #2​

TID 1601​


1.n.1.26.1​

Image Position (Patient) X​

-288.0​

TID 1604​


1.n.1.26.2​

Image Position (Patient) Y​

288.0​

TID 1604​


1.n.1.26.3​

Image Position (Patient) Z​

140.0​

TID 1604​


1.n.2​

Image Library Group​


TID 1600​


1.n.2.1​

Modality​

CT​

TID 1602​


1.n.2.2​

Target Region​

Whole Body​

TID 1602​


1.n.2.3​

Study Date​

20030417​

TID 1602​


1.n.2.4​

Frame of Reference UID​

1.2.3.xyz​

TID 1602​


1.n.2.5​

Pixel Data Rows​

512​

TID 1602​


1.n.2.6​

Pixel Data Columns​

512​

TID 1602​


1.n.2.7​

Horizontal Pixel Spacing​

1.171875 mm​

TID 1604​


1.n.2.8​

Vertical Pixel Spacing​

1.171875 mm​

TID 1604​


1.n.2.9​

Spacing Between Slices​

4 mm​

TID 1604​


1.n.2.10​

Slice Thickness​

4 mm​

TID 1604​


1.n.2.11​

Image Orientation (Patient) Row X​

1​

TID 1604​


1.n.2.12​

Image Orientation (Patient) Row Y​

0​

TID 1604​


1.n.2.13​

Image Orientation (Patient) Row Z​

0​

TID 1604​


1.n.2.14​

Image Orientation (Patient) Column X​

0​

TID 1604​


1.n.2.15​

Image Orientation (Patient) Column Y​

1​

TID 1604​


1.n.2.16​

Image Orientation (Patient) Column Z​

0​

TID 1604​


1.n.2.17​

CTAcquisition Type​

Spiral Acquisition​

TID 1605​


1.n.2.18​

Reconstruction Algorithm​

Filtered Back Projection​

TID 1605​


1.n.2.19​


IMAGE - CT image #1​

TID 1601​


1.n.2.19.1​

Image Position (Patient) X​

-288.0​

TID 1604​


1.n.2.19.2​

Image Position (Patient) Y​

288.0​

TID 1604​


1.n.2.19.3​

Image Position (Patient) Z​

136.0​

TID 1604​


1.n.2.20​


IMAGE - CT image #2​

TID 1601​


1.n.2.20.1​

Image Position (Patient) X​

-288.0​

TID 1604​


1.n.2.20.2​

Image Position (Patient) Y​

288.0​

TID 1604​


1.n.2.20.3​

Image Position (Patient) Z​

140.0​

TID 1604​


- Standard -​

DICOM PS3.17 2020a - Explanatory Information​

Page 679​

TTT X-Ray 3D Angiographic Image Encoding​

Examples (Informative)​

TTT.1 General Concepts of X-Ray 3D Angiography​

This chapter describes the general concepts of the X-Ray 3D Angiography: the acquisition of the projection images, the 3D recon-​ struction, and the encoding of the X-Ray 3D Angiographic Image SOP instances. They provide better understanding of the different​ application cases in the rest of this Annex.​

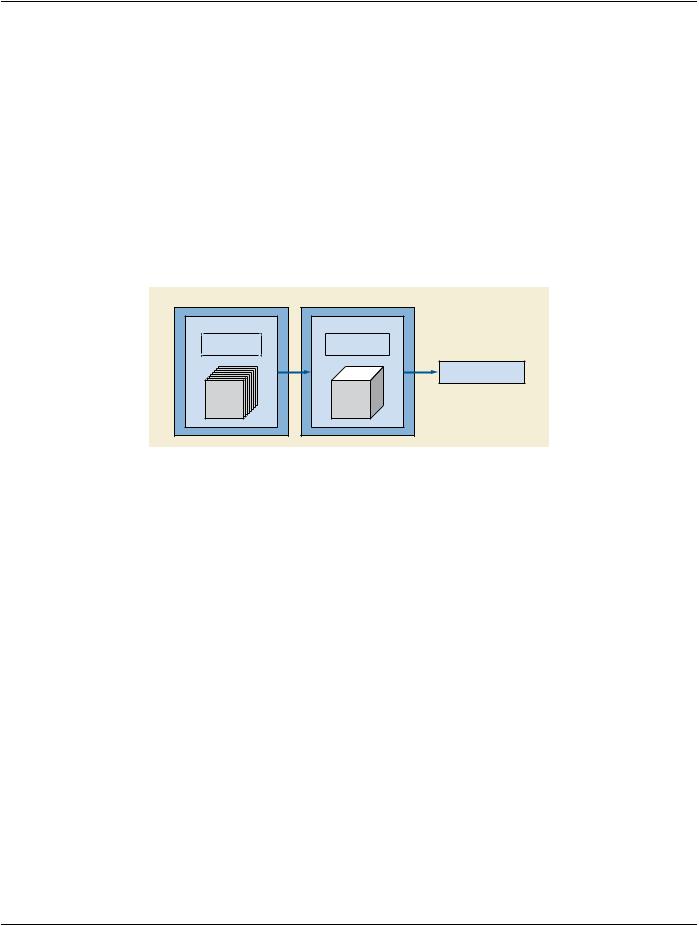
TTT.1.1 Process of Creating An X-Ray 3D Angiography​

Two main steps are involved in the process of creating an X-Ray 3D Angiographic Instance: The acquisition of 2D projections and​ the 3D reconstruction of the volume.​

X-Ray Equipment

3D Reconstruction Application

Acquisition Context

3D Reconstruction

X-Ray Acquisition

3D Reconstruction

Parameters

Parameters

2D

3D

Projection

Volume

X-Ray 3D Angiography

Instance

Figure TTT.1.1-1. Process flow of the X-Ray 3D Angiographic Volume Creation​

TTT.1.1.1 Acquisition of 2D Projections​

The X-Ray equipment acquires 2D projections at different angles. The Acquisition Context describes the technical parameters of a​ set of 2D projection acquisitions that are used to perform a 3D reconstruction. In the scope of the X-Ray 3D Angiographic SOP Class,​ all the projections of an Acquisition Context share common parameter values, such as:​

•​Detector settings, anti-scatter grid, field of view characteristics​

•​Distances from the X-Ray source to the Isocenter and to the detector, table position and table angles​

•​Focal spot, spectral filters​

•​Contrast injection details​

If one value of such common parameters changes during the acquisition of the projections, then more than one Acquisition Context​ will be defined.​

TypicallytheprojectionsofanAcquisitionContextaretheresultofarotationalacquisitionwheretheX-Raypositionerfollowsacircular​ trajectory. However, it is possible to define an Acquisition Context as the set of multiple projections at different X-Ray incidences​ without a particular spatial trajectory.​

An Acquisition Context is characterized by a period of time in which all the projections are acquired. Some other parameters are used​ to describe the Acquisition Context: start and end DateTime, average exposure techniques (mA, kVp, exposure duration, etc.), posi-​ tioner start, end and increment angles.​

Additionally, other technical parameters that change at each projection can be documented in the X-Ray 3D Angiographic SOP Class​ on a per-projection basis:​

- Standard -​

Page 680​

DICOM PS3.17 2020a - Explanatory Information​

•​kVp, mA, exposure duration​ •​Collimator shape and dimensions​ •​X-Ray positioner angles​

TTT.1.1.2 3D Reconstruction​

The 3D Reconstruction Application performing the 3D Reconstruction can be located in the same X-Ray equipment or in another​ workstation.​

A 3D Reconstruction in the scope of the X-Ray 3D Angiographic SOP Class is the creation of one X-Ray 3D Angiographic volume​ fromasetofprojectionsfromoneormoreAcquisitionContext(s).Therefore,one3DReconstructioninthisscopereferstotheresulting​ volume, and not to the application logic to process the projections. This application logic is out of the scope of this SOP Class, the​ same encoding will result whether several 3D Reconstructions are performed in a single or in multiple application steps to create​ several volumes (e.g., low and high resolution volumes) from the same set of projections.​

One 3D Reconstruction is characterized by some parameters like name, version, manufacturer, description and the type of algorithm​ used to process the projections.​

The 3D Reconstruction can use one or more Acquisition Contexts to generate one single X-Ray 3D Angiographic Volume. Several​ 3D Reconstructions can be encoded in one single X-Ray 3D Angiographic Instance.​

TTT.1.2 X-Ray 3D Angiographic Real World Entities Relationships​

This section describes the relationships between the real world entities involved in X-Ray 3D Angiography.​

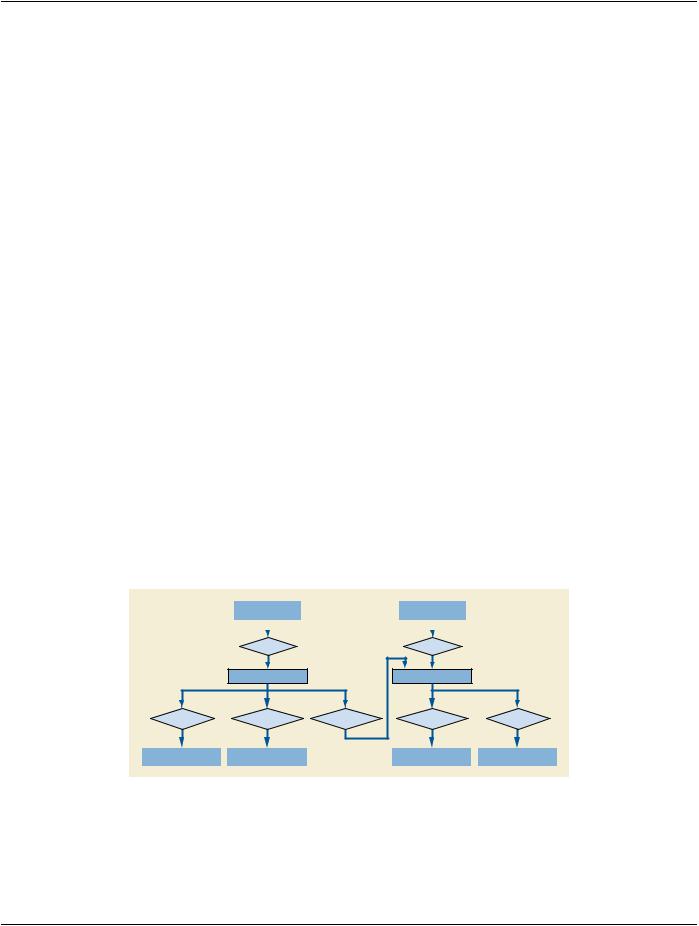
The X-Ray equipment creates one or more acquisition contexts (i.e., one or more rotational acquisitions with different technical​ parameters). The projections can be kept internal to the equipment (i.e., not exported outside the equipment) or can be encoded as​ DICOMinstances.InthescopeoftheX-Ray3DAngiographicSOPClass,theprojectionscanbeencodedeitherasX-RayAngiography​ SOP Class or Enhanced XA SOP Class.​

If the projections are encoded as DICOM Instances, they can be referenced in the X-Ray 3D Angiographic image as Contributing​ Sources. Each Acquisition Context refers to all the DICOM instances involved in that context. If the projections are kept internal to​ the equipment, the X-Ray 3D Angiographic image can still describe the technical parameters of each acquisition context without ref-​ erencing any DICOM instance.​

The 3D Reconstruction Application creates one or more 3D Reconstructions, each 3D Reconstruction uses one or more Acquisition​ Contexts. One or more 3D Reconstructions can be encoded in one single X-Ray 3D Angiographic Instance.​

X-Ray Equipment


3D Reconstruction


Application


creates


creates


Acquisition Context


consists of

is encoded in

is used by

3D Reconstruction

is encoded in

consists of

X-Ray 2D Angiography


(Multiframe 2D) X-Ray


X-Ray 3D Angiography


X-Ray 3D Angiographic

Projection


Angiography Instance


Instance


Volume

Figure TTT.1.2-1. Relationship between the creation of 2D and 3D Instances​

TTT.1.3 X-Ray 3D Angiographic Pixel Data Characterization​

Similarly to other 3D modalities like CT or MR, the X-Ray 3D Angiographic image is generated from original source data (i.e., original​ projections) which can be kept internal to the equipment. In this sense, the 3D data resulting from the reconstruction of the original​

- Standard -​

Источник: https://studfile.net/preview/14585770/