Page 398 |
DICOM PS3.17 2020a - Explanatory Information |
3.Phoropter (or phoroptor):an instrument containing multiple lenses, that is used in the course of an eye exam to determine the individual's subjective response to various lenses (subjective refraction) and the need for glasses or contact lenses.. The patient looks through the phoropter lenses at an eye chart that may be at 20 ft or 6m or at a reading chart that may be at 40 cm. Inform- ation from the subjective refraction can be uploaded from an autophoropter to a computer. The best corrected vision that was obtained is displayed in an autoprojector, and that information can also be uploaded to a computer.
4.Autokeratometer: an autokeratometer is used to measure the curvature, and thus the refractive power, of a patient's cornea. Two measurements are generally taken, one at the steepest and one at the flattest meridian of the cornea. The meridian measured is expressed in degrees, whole integers, in increments of 1 degree. If the measurement is expressed as power, the unit of measurement is diopters, to 3 decimal points, in increments of 0.125D. If the measurement is expressed as radius of curvature, the unit of measurement is millimeters, to 2 decimal points, in increments of 0.01 mm.
RR.2 Reference Tables For Equivalent Visual Acuity Notations
RR.2.1 Background
Visual acuity is defined as the reciprocal of the ratio between the letter size that can just be recognized by a patient, relative to the size just recognized by a standard eye. If the patient requires letters that are twice as large (or twice as close), the visual acuity is said to be 1/2; if the letters need to be 5x larger, visual acuity is 1/5, and so on.
Note that the scales in the tables extend well above the reference standard (1.0, 20/20, the ability to recognize a letter subtending a visual angle 5 min. of arc), since normal acuity is often 1.25 (20/16), 1.6 (20/12.5) or even 2.0 (20/10).
Today, the ETDRS chart and ETDRS protocol, established by the National Eye Institute in the US, are considered to represent the de facto gold standard for visual acuity measurements The International Council Of Ophthalmology, Visual Standard, Aspects and Ranges of Vision Loss (April, 2002) is a good reference document.
The full ETDRS protocol requires a wide chart, in the shape of an inverted triangle, on a light box, and cannot be implemented on the limited screen of a projector (or similar) chart.
Formostroutineclinicalmeasurementsprojectorchartsortraditionalchartswitharectangularshapeareused;thesenon-standardized tools are less accurate than ETDRS measurements.
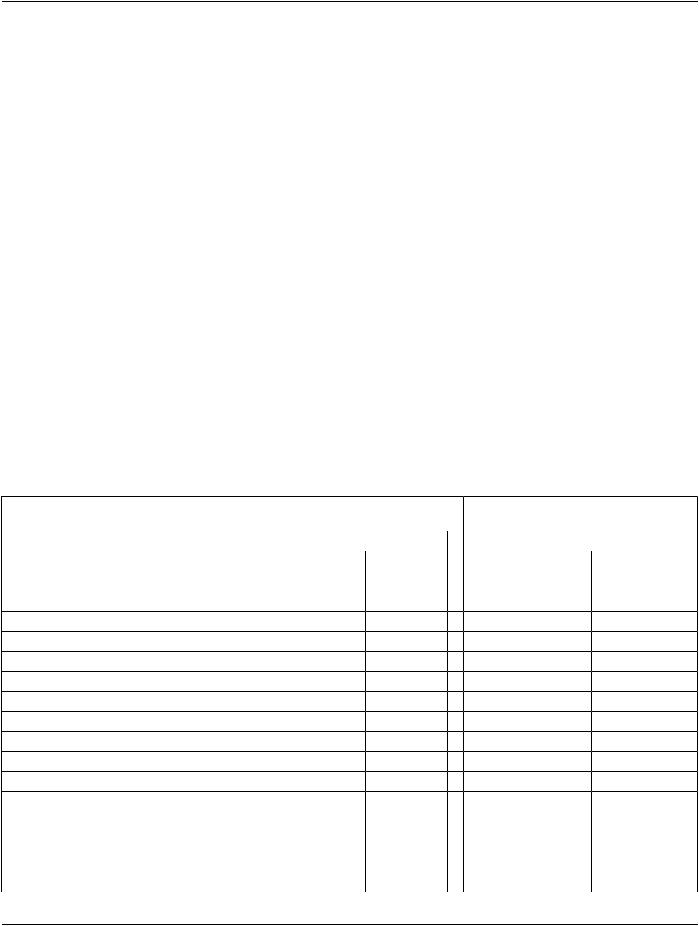
This appendix contains two lookup tables, one for traditional charts and one for ETDRS measurements.
RR.2.2 Notations
Various notations may be used to express visual acuity. Snellen (in 1862) used a fractional notation in which the numerator indicated the actual viewing distance; this notation has long been abandoned for the use of equivalent notations, where the numerator is standardized to a fixed value, regardless of the true viewing distance. In Europe the use of decimal fractions is common (1/2 = 0.5, 1/5 = 0.2); in the US the numerator is standardized at 20 (1/2 = 20/40, 1/5 = 20/100), while in Britain the numerator 6 is common (1/2 = 6/12, 1/5 = 6/30).
The linear scales on the right side of the tables are not meant for clinical records. They are required for statistical manipulations, such ascalculationofdifferences,trendsandaveragesandpreferredforgraphicalpresentations.Theyconvertthelogarithmicprogression of visual acuity values to a linear one, based on Weber-Fechner's law, which states that proportional stimulus increases lead to linear increases in perception.
The logMAR scale is calculated as log (MAR) = log (1/V) = - log (V). LogMAR notation is widely used in scientific publications. Note that it is a scale of vision loss, since higher values indicate poorer vision. The value "0" indicates "no loss", that is visual acuity equal to the reference standard (1.0, 20/20). Normal visual acuity (which is better than 1.0 (20/20) ) is represented by negative logMAR values.
The VAS scale (VAS = Visual Acuity Score) serves the same purpose. Its formula is: 100 - 50 x logMAR or 100 + 50 x log (V). It is more user friendly, since it avoids decimal values and is more intuitive, since higher values indicate better vision. The score is easily calculated on ETDRS charts, where 1 point is credited for each letter read correctly. The VAS scale also forms the basis for the cal- culation of visual impairment ratings in the AMA Guides to the Evaluation of Permanent Impairment.