Материал: part17

Внимание! Если размещение файла нарушает Ваши авторские права, то обязательно сообщите нам

DICOM PS3.17 2020a - Explanatory Information​

Page 431​

YY Compound and Combined Graphic​

Objects in Presentation States (Informative)​

Presentation States may contain Compound Graphics and combined graphic objects. Two illustrative examples are given in this in-​ formative annex to explain these two concepts.​

First, an example of a Compound Graphic is given, an AXIS object, and secondly an example of a combined graphic object is given,​ a distance line.​

TherenderedappearanceoftheCompoundGraphics(suchasillustratedinFigureYY-1)arerecommendationsandarenotmandatory.​ For example, the Compound Graphic 'AXIS' can look slightly different on different viewing workstations.​

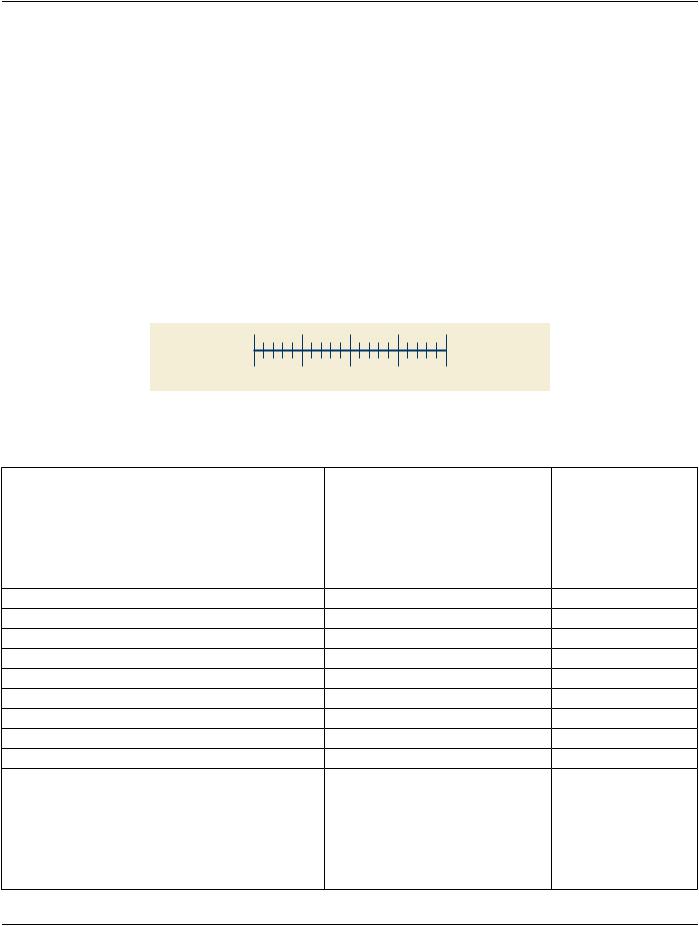
YY.1 An Example of The Compound Graphic 'axis'​

The AXIS from Figure YY-1 is defined in the following Compound Graphic Sequence (0070,0209) (see the following Table YY-1). An​ AXIS object is typically used for measurement purposes.​

20 30 40 50 60

Figure YY-1. Compound Graphic 'AXIS'​

Table YY-1. Graphic Annotation Module Attributes​

Attribute Name​

Tag​

Attribute Value​

Graphic Annotation Sequence​

(0070,0001)​

…​

…​


>Compound Graphic Sequence​

(0070,0209)​


>>Compound Graphic Instance ID​

(0070,0226)​

1​

>>Compound Graphic Units​

(0070,0282)​

PIXEL​

>>Graphic Dimensions​

(0070,0020)​

2​

>>Number of Graphic Points​

(0070,0021)​

2​

>>Graphic Data​

(0070,0022)​

10\10\150\10​

>>Compound Graphic Type​

(0070,0294)​

AXIS​

>>Major Ticks Sequence​

(0070,0287)​


%item​


>>>Tick Position​

(0070,0288)​

0​

>>>Tick Label​

(0070,0289)​

20​

%enditem​


%item​


>>>Tick Position​

(0070,0288)​

0.25​

>>>Tick Label​

(0070,0289)​

30​

%enditem​


%item​


>>>Tick Position​

(0070,0288)​

0.5​

- Standard -​

Page 432​

DICOM PS3.17 2020a - Explanatory Information​


Attribute Name​

Tag​

Attribute Value​

>>>Tick Label​

(0070,0289)​

40​

%enditem​


%item​


>>>Tick Position​

(0070,0288)​

0.75​

>>>Tick Label​

(0070,0289)​

50​

%enditem​


%item​


>>>Tick Position​

(0070,0288)​

1.0​

>>>Tick Label​

(0070,0289)​

60​

%enditem​


%endseq​


>>Tick Alignment​

(0070,0274)​

CENTER​

>>Tick Label Alignment​

(0070,0279)​

BOTTOM​

>>Show Tick Label​

(0070,0278)​

Y​

The following table shows the simple graphic objects for an axis. The breakdown of the axis into simple graphics is up to the imple-​ mentation. The Compound Graphic Instance ID (0070,0226) is used to relate the compound and the simple representation. To keep​ the example short only the first major tick is shown.​

Table YY-2. Graphic Annotation Module Attributes​

Attribute Name​

Tag​

Attribute Value​

Comment​

Graphic Annotation Sequence​

(0070,0001)​

…​


…​


>Text Object Sequence​

(0070,0008)​


Tick Labels​

>>Anchor Point Annotation Units​

(0070,0004)​

PIXEL​

First Tick Label​

>>Anchor Point​

(0070,0014)​

8/22​


>>Anchor Point Visibility​

(0070,0015)​

N​


>>Unformatted Text Value​

(0070,0006)​

20​


>>Compound Graphic Instance ID​

(0070,0226)​

1​


…​


>Graphic Object Sequence​

(0070,0009)​


Primary Axis Line​

>>Graphic Annotation Units​

(0070,0005)​

PIXEL​


>>Graphic Dimensions​

(0070,0020)​

2​


>>Number of Graphic Points​

(0070,0021)​

2​


>>Graphic Data​

(0070,0022)​

10\10\150\10​


>>Graphic Type​

(0070,0023)​

POLYLINE​


>>Compound Graphic Instance ID​

(0070,0226)​

1​


…​


>>Graphic Annotation Units​

(0070,0005)​

PIXEL​

First Major Tick​

>>Graphic Dimensions​

(0070,0020)​

2​


>>Number of Graphic Points​

(0070,0021)​

2​


>>Graphic Data​

(0070,0022)​

10\5\10\15​


>>Graphic Type​

(0070,0023)​

POLYLINE​


- Standard -​


DICOM PS3.17 2020a - Explanatory Information​

Page 433​

Attribute Name​

Tag​

Attribute Value​

Comment​

>>Compound Graphic Instance ID​

(0070,0226)​

1​


…​


YY.2 An Example of Distance Line Defined As A Combined Graphic Object​

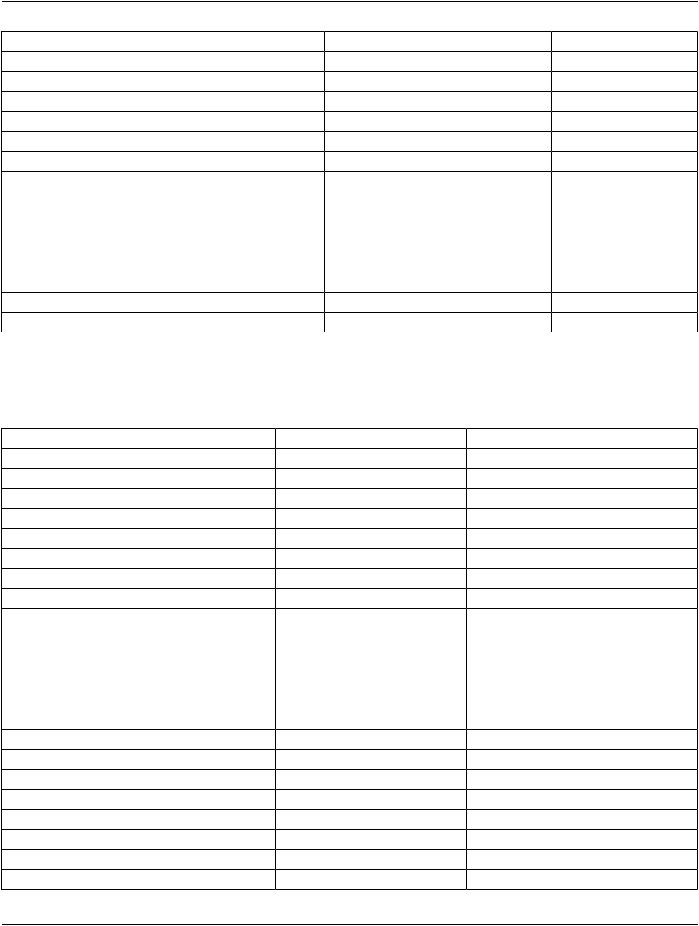
Now, a distance line is defined as a combined graphic object, i.e., grouping a text object with a polyline graphic object (see Figure YY-​ 2). Distance lines are typically used for measurements and for computing the grayscale values along this line to build up a profile​ curve.​

This simple example is intended to show how the Graphic Group ID (0070,0295) is used for grouping of graphic annotations.​

52.20 mm

Figure YY-2. Combined Graphic Object 'DistanceLine'​

Table YY-3. Graphic Group Module​

Attribute Name​

Tag​

Attribute Value​

Graphic Group Sequence​

(0070,0234)​


>Graphic Group ID​

(0070,0295)​

1​

>Graphic Group Label​

(0070,0207)​

DistanceLine​

>Graphic Group Description​

(0070,0208)​

Measurement Tool​

Table YY-4. Graphic Annotation Module Attributes​

Attribute Name​

Tag​

Attribute Value​

Graphic Annotation Sequence​

(0070,0001)​

…​

…​


>Text Object Sequence​

(0070,0008)​


>>Anchor Point Annotation Units​

(0070,0004)​

PIXEL​

>>Anchor Point​

(0070,0014)​

70/20​

>>Anchor Point Visibility​

(0070,0015)​

N​

>>Unformatted Text Value​

(0070,0006)​

52.20 mm​

>>Graphic Group ID​

(0070,0295)​

1​

…​


>Compound Object Sequence​

(0070,0009)​


>>Graphic Annotation Units​

(0070,0005)​

PIXEL​

>>Graphic Dimensions​

(0070,0020)​

2​

>>Number of Graphic Points​

(0070,0021)​

2​

>>Graphic Data​

(0070,0022)​

10\10\150\10​

>>Graphic Type​

(0070,0023)​

POLYLINE​

>>Graphic Group ID​

(0070,0295)​

1​

- Standard -​

Page 434​

DICOM PS3.17 2020a - Explanatory Information​

- Standard -​

DICOM PS3.17 2020a - Explanatory Information​

Page 435​

ZZ Implant Template Description​

ZZ.1 Implant Mating​

In this section, the usage of mating features for assembly of implants is declared.​

ZZ.1.1 Mating Features​

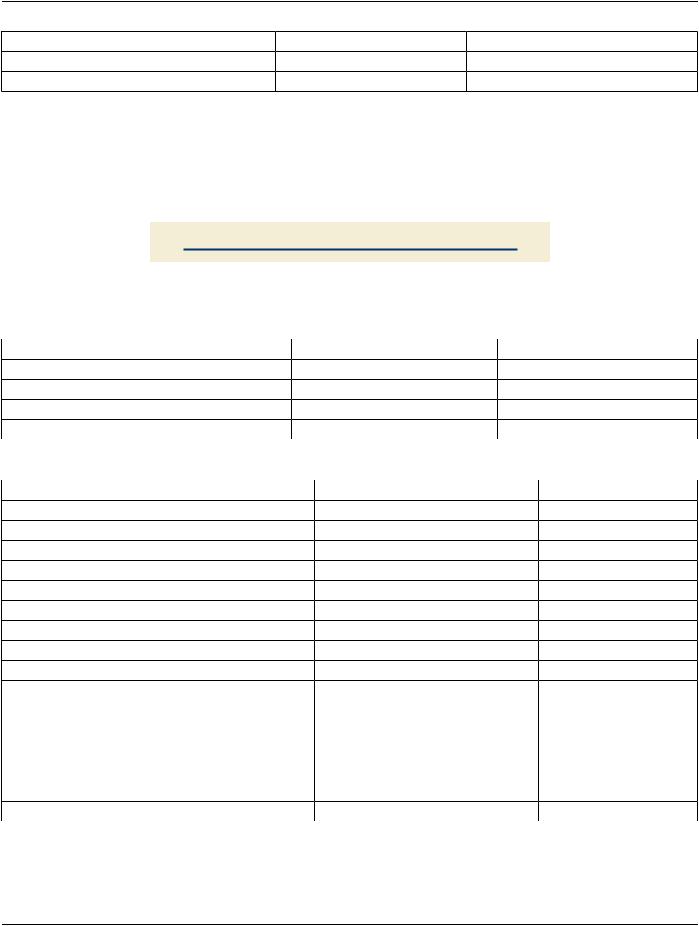
These Attributes establish a Cartesian coordinate system relative to the Frame of Reference of the implant. When two implants are​ assembled using a pair of mating features, a rigid spatial registration can be established, that transforms one Frame of Reference so​ that the mating features align. The figure below gives a simple example in 2D how two implants (symbolized by two rectangles) are​ matched according to a mating feature pair. For each 2D and 3D template present, a set of coordinates is assigned to each Mating​ Feature Sequence Item.​

2

2

1

1

Figure ZZ.1-1. Implant Template Mating (Example).​

ZZ.1.2 Mating Feature ID​

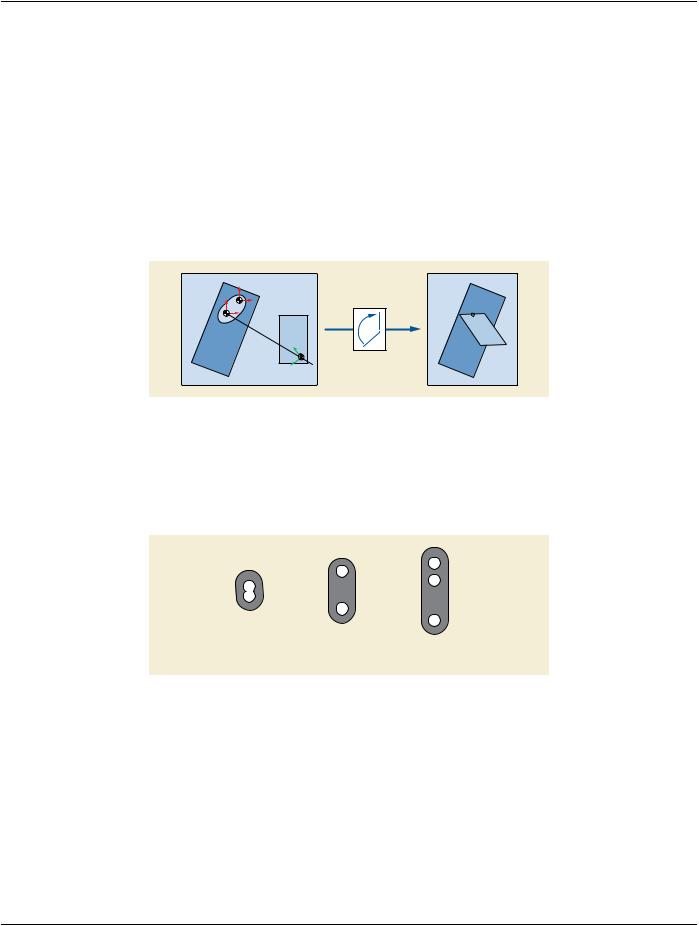
It is recommended to give Mating Features that are somehow related, the same Mating Feature ID (0068,63F0) in different implant​ templates. This may help applications to switch between components while keeping connections to other components. The Example​ in Figure ZZ.1-2 shows that the first and the last hole in the plates get the same Mating Feature ID in each Template.​


+

ID10

+

ID10

ID10

+

ID15


+


+


ID20

+

ID20


+

ID20

Implant

Implant


Implant


Template 1

Template 2

Template 3

Figure ZZ.1-2. Implant Template Mating Feature IDs (Example)​

ZZ.1.3 Mating Feature Sets​

The Mating Features are organized in sets of alternative features: Only one feature of any set shall be used for assembly with other​ componentsinoneplan.Thisenablesthedefinitionofvariantsforonekindofcontactacomponentcanmakewhileensuringconsistent​ plans.​

An example for Mating Feature Sets is shown in Figure ZZ.1-3. A hip stem template shows a set of five mating features, drawn as​ circles on the tip of its cone. Different head components use different mating points, depending on the base radius of the conic intake​ on the head.​

- Standard -​

Источник: https://studfile.net/preview/14585770/