Материал: part17

Внимание! Если размещение файла нарушает Ваши авторские права, то обязательно сообщите нам

DICOM PS3.17 2020a - Explanatory Information​

Page 471​

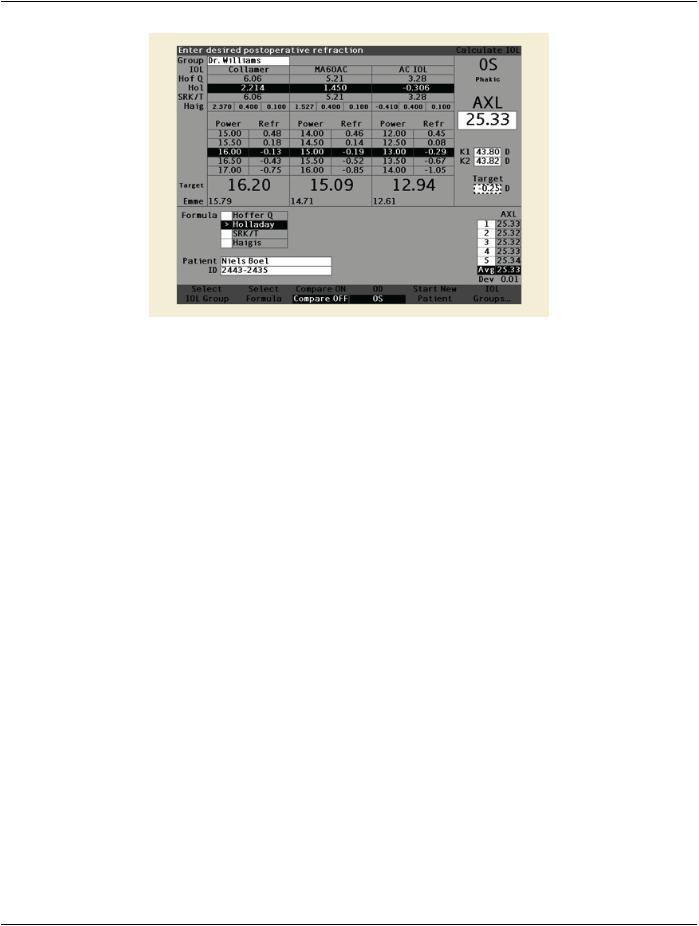
Figure CCC.5-1. IOL Calculation Results Example​

On the right the selected target refractive correction (e.g., glasses, contact lenses, etc.) is -0.25 diopters. At the top of the table three​ possible intraocular lens models are displayed, along with the constants (CID 4237 “Lens Constant Type”) specific to those lens​ models. Each row in that part of the table displays constants required for a particular formula. In this example the Holladay formula​ has been selected by the operator, and results are displayed in the body of the table below. Calculated intraocular lens powers are​ displayed with the predicted postoperative refractive error (e.g., glasses, contact lenses, etc.) for each lens. K1 and K2 on the right​ refer to the keratometry values (corneal curvature), in diopters, used for these calculations.​

- Standard -​

Page 472​

DICOM PS3.17 2020a - Explanatory Information​

- Standard -​

DICOM PS3.17 2020a - Explanatory Information​

Page 473​

DDD Visual Field Static Perimetry Use Cases​ (Informative)​

DDD.1 Introduction​

Automated visual fields are the most commonly used method to assess the function of the visual system. This is accomplished by​ sequentially presenting visual stimuli to the patient and then requiring the patient press a button if he/she perceives a stimulus. The​ stimuli are presented at a variety of points within the area expected to be visible to the patient and each of those points is tested with​ multiple stimuli of varying intensity. The result of this is a spatial map indicating how well the patient can see throughout his/her visual​ field.​

DDD.2 Use Cases​

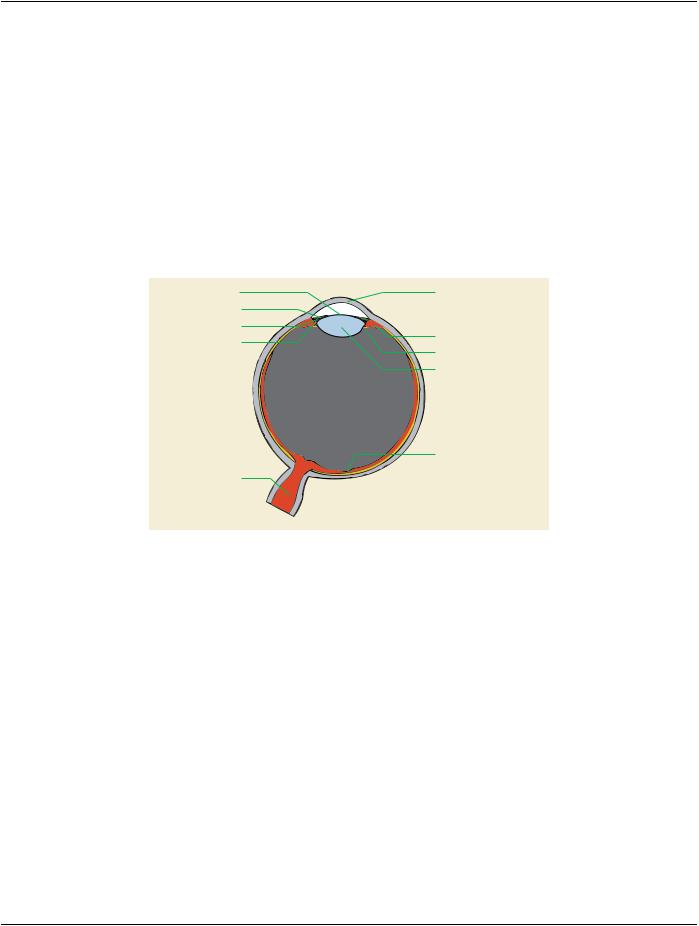
Pupil


Cornea

Iris


Anterior chamber


Posterior chamber


filled with aqueous humor


Zonular fibers


Ciliary muscle


Retina


Suspensory ligament


Lens


Choroid


Vitreous humor


Sclera


Fovea


Optic disc


Optic nerve


Figure DDD.2-1. Schematic Representation of the Human Eye​

- Standard -​

Page 474​

DICOM PS3.17 2020a - Explanatory Information​

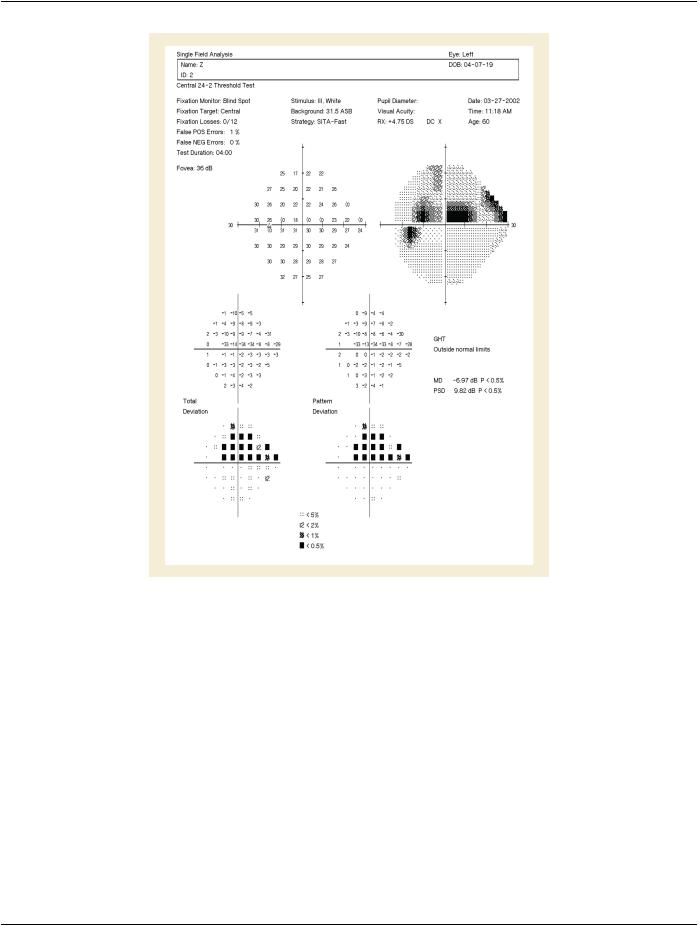
Figure DDD.2-2. Sample Report from an Automated Visual Field Machine​

DDD.2.1 Evaluation For Glaucoma​

The diagnosis and management of Glaucoma, a disease of the optic nerve, is the primary use of visual field testing. In this regard,​ automated visual fields are used to assess quantitatively the function of the optic nerve with the intent of detecting defects caused​ by glaucoma.​

The first step in analyzing a visual field report is to confirm that it came from the correct patient. Demographic information including​ the patient's name, gender, date of birth, and perhaps medical record number are therefore essential data to collect. The patient's​ age is also important in the analysis of the visual field (see below) as optic nerve function changes with age. Finally, it is important to​ document the patient's refractive error as this needs to be corrected properly for the test to be valid.​

Second, the clinician needs to assess the reliability of the test. This can be determined in a number of ways. One of these is by​ monitoring patient fixation during the test. To be meaningful, a visual field test assumes that the subject was looking at a fixed point​ throughout the test and was responding to stimuli in the periphery. Currently available techniques for monitoring this fixation include​ blind spot mapping, pupil tracking, and observation by the technician conducting the test. Blind spot mapping starts by identifying the​ small region of the visual field corresponding to the optic nerve head. Since the patient cannot detect stimuli in this area, any positive​ response to a stimulus placed there later in the test indicates that the patient has lost fixation and the blind spot has "moved". Both​ pupil tracking and direct observation by the technician are now easily carried out using a camera focused on the patient's eye.​

- Standard -​

DICOM PS3.17 2020a - Explanatory Information​

Page 475​

Fixation Monitor:

Blind Spot

Fixation Target:

Central

Fixation Losses:

0/12

False POS Errors:

1%

False NEG Errors:

0%

Test Duration:

04:00

Figure DDD.2-3. Information Related to Test Reliability​

Anothermeansofassessingthereliabilityofthetestistocountbothfalsepositiveandfalsenegativeresponses.Falsepositivesoccur​ when the subject presses the button either in response to no stimulus or in response to a stimulus with intensity significantly below​ one they had not detected previously. False negatives are recorded when the patient fails to respond to stimulus significantly more​ intense than one they had previously seen. Taken together, fixation losses, false positives, and false negatives provide an indication​ of the quality of the test.​

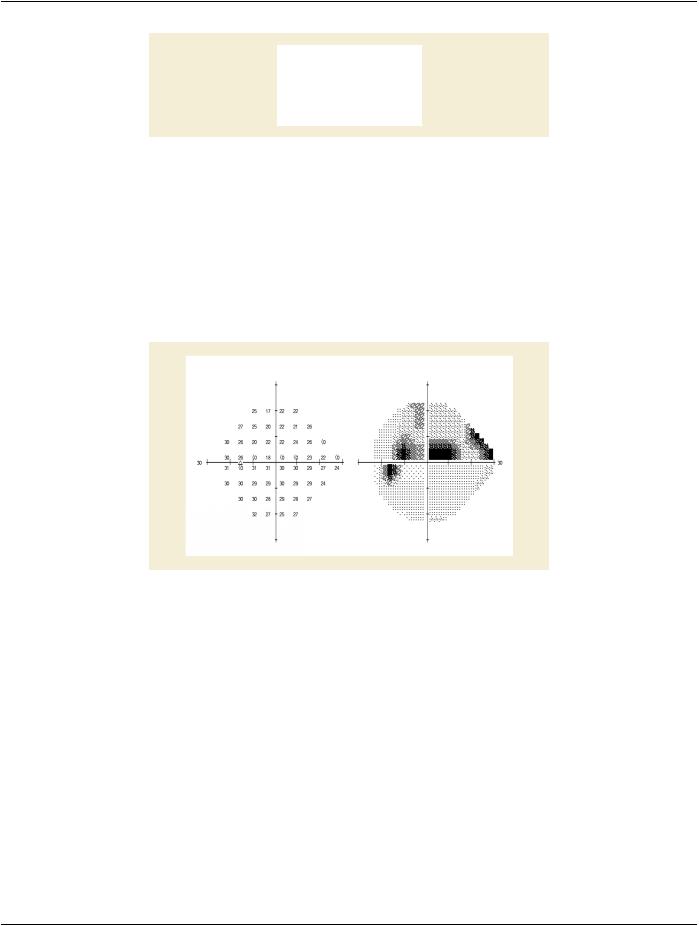
The next phase of visual field interpretation is to assess for the presence of disease. The first aspect of the visual field data used here​ are the raw sensitivity values. These are usually expressed as a function of the amount of attenuation that could be applied to the​ maximum possible stimulus such that the patient could still see it when displayed. Since a value is available at each point tested in​ the visual field, these values can be represented either as raw values or as a graphical map.​

Figure DDD.2-4. Sample Output from an Automated VF Machine Including Raw Sensitivity Values (Left,​ Larger Numbers are Better) and an Interpolated Gray-Scale Image​

Because the raw intensity values can be affected by a number of factors including age and other non-optic nerve problems including​ refractive error or any opacity along the visual axis (cornea, lens, vitreous), it is helpful to also evaluate some corrected values. One​ set of corrected intensity values is usually some indication of the difference of each tested point from its expected value based on​ patient age. Another set of corrected intensity values, referred to as "Pattern deviation or "Corrected comparison" are normalized for​ age and also have a value subtracted from the deviation at each test point, which is estimated to be due to diffuse visual field loss​ This latter set is useful for focal rather than diffuse defects in visual function. In the case of glaucoma and most other optic nerve​ disease, clinicians are more interested in focal defects so this second set of normalized data is useful.​

- Standard -​

Источник: https://studfile.net/preview/14585770/