Материал: part17

Внимание! Если размещение файла нарушает Ваши авторские права, то обязательно сообщите нам

DICOM PS3.17 2020a - Explanatory Information​

Page 481​

EEE Intravascular OCT Image (Informative)​

EEE.1 Purpose of This Annex​

The purpose of this annex is to explain key IVOCT FOR PROCESSING parameters, describe the relationship between IVOCT FOR​ PROCESSING and FOR PRESENTATION images. It also explains Intravascular Longitudinal Reconstruction.​

EEE.2 IVOCT For Processing Parameters​

EEE.2.1 Z Offset Correction​

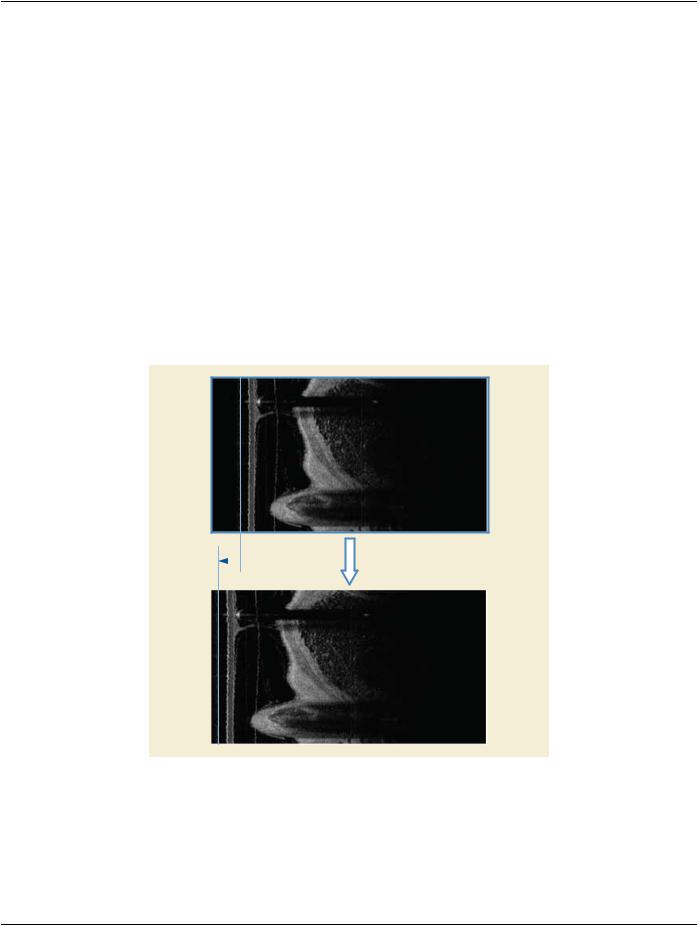
When an OCT image is acquired, the path length difference between the reference and sample arms may vary, resulting in a shift​ along the axial direction of the image, known as the Z Offset. With FOR PROCESSING images, in order to convert the image in​ Cartesian coordinates and make measurements, this Z Offset should be corrected, typically on a per-frame or per-image basis. Z​ Offset is corrected by shifting Polar data rows (A-lines) + OCT Z Offset Correction (0052,0030) pixels along the axial dimension of​ the image.​

Z Offset correction may be either a positive or negative value. Positive values mean that the A-lines are shifted further away from the​ catheter optics. Negative values mean that the A-lines are shifted closer to the catheter optics. Figure EEE.2-1 illustrates a negative​ Z Offset Correction.​


Shift rows -


z-offset

z-offset pizels


Figure EEE.2-1. Z Offset Correction​

EEE.2.2 Refractive Index Correction​

The axial distances in an OCT image are dependent on the refractive index of the material that IVOCT light passes through. As a​ result, in order to accurately make measurements in images derived from FOR PROCESSING data, the axial dimension of the pixels​ shouldbegloballycorrectedbydividingtheA-linePixelSpacing(0052,0014)value(inair)bytheEffectiveRefractiveIndex(0052,0004)​

- Standard -​

Page 482​

DICOM PS3.17 2020a - Explanatory Information​

and setting the Refractive Index Applied (0052,003A) to YES. Although not recommended, if A-line Pixel Spacing (0052,0014) is re-​ ported in air (i.e., not corrected by dividing by Effective Refractive Index) then the Refractive Index Applied value shall be set to NO.​

EEE.2.3 Polar-Cartesian Conversion​

FORPROCESSINGPolardataisspecifiedsuchthateachcolumnrepresentsasubsequentaxial(z)locationandeachrowanangular​

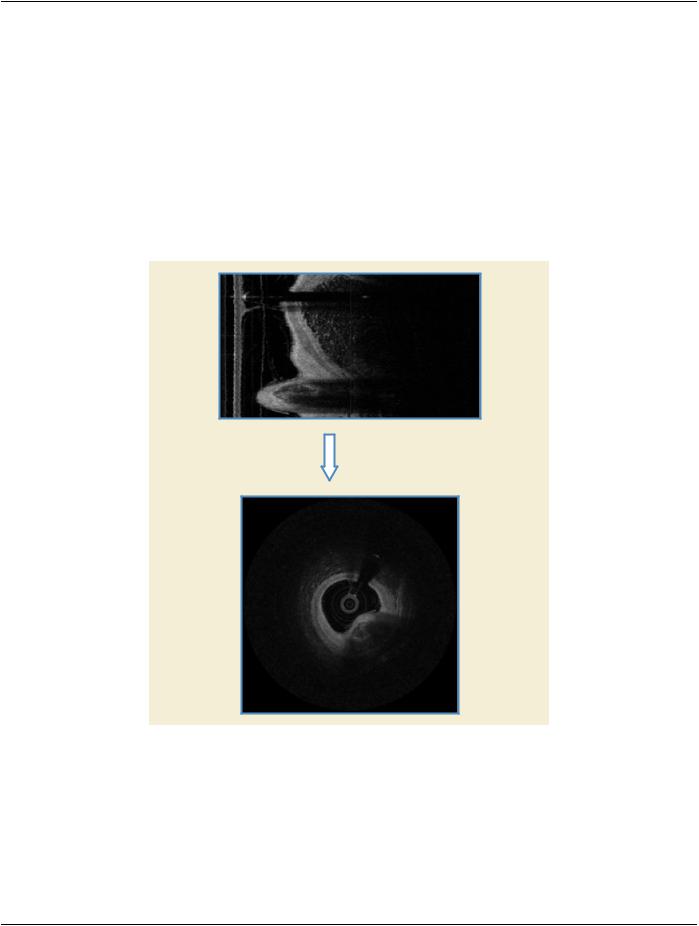
(q) coordinate. Following Z Offset and Refractive Index Correction, Polar data can be converted to Cartesian data by first orienting​ the seam line position so that it is at the correct row location. This can be accomplished by shifting the rows Seam Line Index​ (0052,0036) pixels so that its Seam Line Location (0052,0033) is located at row "A-lines Per Frame * Seam Line Location / 360".​ Once the seam line is positioned correctly, the Cartesian data can be obtained by remapping the Polar (z, q) data into Cartesian (x,​ y) space, where the leftmost column of the Polar image corresponds to the center of the Cartesian image. Figure EEE.2-2 illustrates​ the Polar to Cartesian conversion. The scan-converted frames are constructed using the Catheter Direction of Rotation (0052,0031)​ Attribute to determine the order in which the A-lines are acquired. Scan-converted frames are constructed using A-lines that contain​ actual data (I.e., not padded A-lines). Padded A-lines are added at the end of the frame and are contiguous. Figure EEE.2-2 is an​ example of Polar to Cartesian conversion.​

Polar to

Cartesian

Figure EEE.2-2. Polar to Cartesian Conversion​

EEE.3 Intravascular Longitudinal Image​

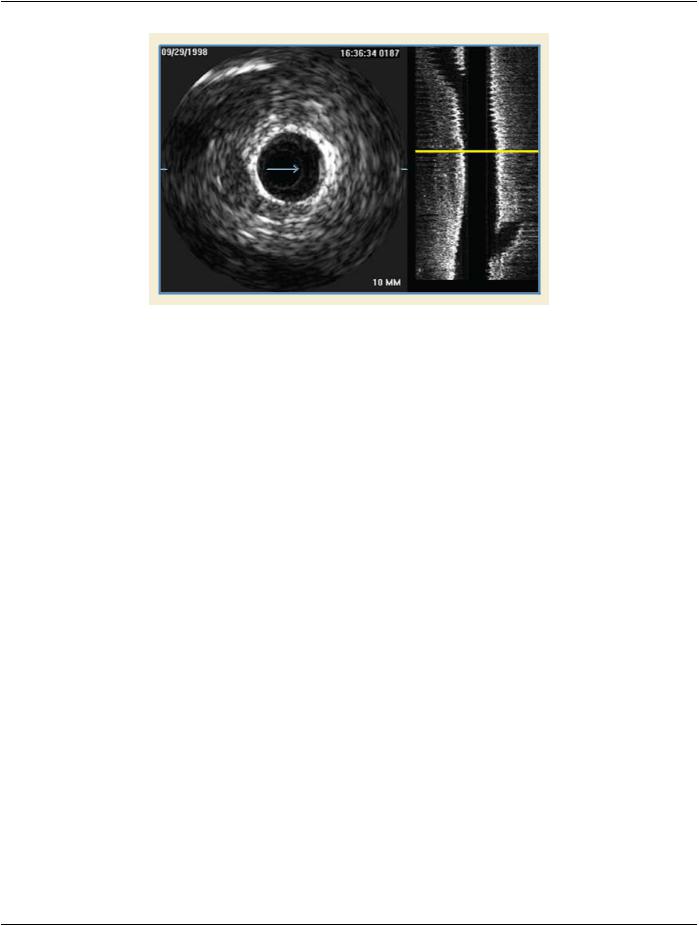
An Intravascular Longitudinal Image (L-Mode) is a constrained three-dimensional reconstruction of an IVUS or IVOCT Multi-frame​ Image.TheLongitudinalImagecanbereconstructedfromeitherFORPROCESSINGorFORPRESENTATIONImages.FigureEEE.3-​ 1 is an example of an IVUS cross-sectional image (on the left) with a reconstructed longitudinal view (on the right).​

- Standard -​

DICOM PS3.17 2020a - Explanatory Information​

Page 483​

Current Frame Marker

Longitudinal Slice Indicator

Figure EEE.3-1. IVUS Image with Vertical Longitudinal View​

The Longitudinal reconstruction is comprised of a series of perpendicular cut planes, typically consisting of up to 360 slices spaced​ in degree increments. The cut planes are perpendicular to the cross-sectional plane, and rotate around the catheter axis (I.e., center​ of the catheter) to provide a full 360 degrees of rotation. A longitudinal slice indicator is used to select the cut plane to display, and​ is normally displayed in the associated cross-sectional image (e.g., blue arrow cursor in Figure EEE.3-1). A current frame marker​ (e.g., yellow cursor located in the longitudinal view) is used to indicate the position of the corresponding cross-sectional image, within​ the longitudinal slice.​

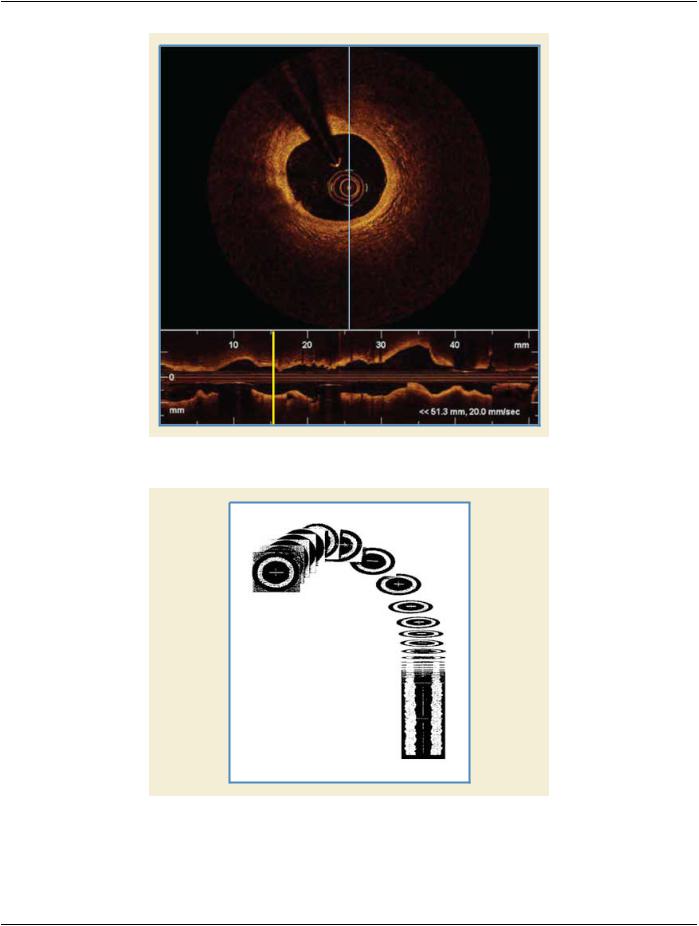
When pullback rate information is provided, distance measurements are possible along the catheter axis. The Intravascular Longitud-​ inal Distance (0052,0028) or IVUS Pullback Rate (0018,3101) Attributes are used along with the Frame Acquisition DateTime​ (0018,9074)Attributetofacilitatemeasurementcalculations.Thisallowsforlesion,calcium,stentandstentgaplengthmeasurements.​ Figure EEE.3-2 is an example of an IVOCT cross-sectional image (on the top), with a horizontal longitudinal view on the bottom. The​ following example also illustrates how the tint specified by the Palette Color LUT is applied to the OCT image.​

- Standard -​

Page 484​

DICOM PS3.17 2020a - Explanatory Information​

Longitudinal Slice Indicator

Current Frame Marker

Figure EEE.3-2. IVOCT Image with Horizontal Longitudinal View​

Figure EEE.3-3. Longitudinal Reconstruction​

Figure EEE.3-3 illustrates how the 2D cross-sectional frames are stacked along the catheter longitudinal axis. True geometric repres-​ entation of the vessel morphology cannot be rendered, since only the Z position information is known. Position (X and Y) and rotation​ (X, Y and Z) information of the acquired cross-sectional frames is unknown.​

- Standard -​

DICOM PS3.17 2020a - Explanatory Information​

Page 485​

FFF Enhanced XA/XRF Encoding Examples​ (Informative)​

FFF.1 General Concepts of X-Ray Angiography​

This chapter describes the general concepts of the X-Ray Angiography equipment and the way these concepts can be encoded in​ SOP Instances of the Enhanced XA SOP Class. It covers the time relationships during the image acquisition, the X-Ray generation​ parameters, the conic projection geometry in X-Ray Angiography, the pixel size calibration as well as the display pipeline.​

The following general concepts provide better understanding of the examples for the different application cases in the rest of this​ Annex.​

FFF.1.1 Time Relationships​

FFF.1.1.1 Time Relationships of A Multi-frame Image​

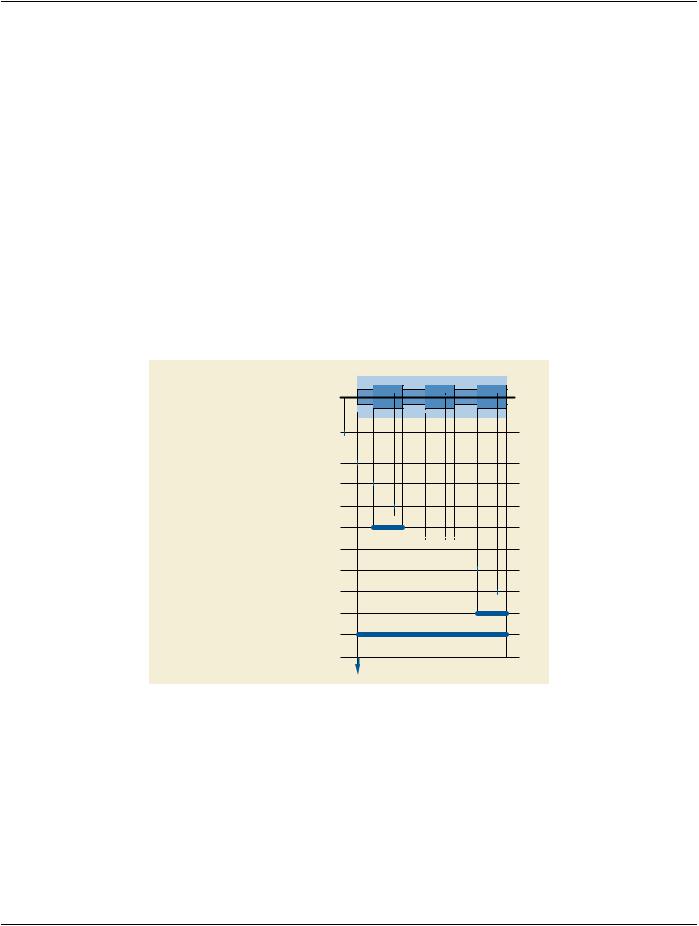
The following figure shows the time-related Attributes of the acquisition of X-Ray Multi-frame Images. The image and frame time At-​ tributes are defined as absolute times, the duration of the entire image acquisition can be then calculated.​

FRAME 1

FRAME i

FRAME n

time

Content Date (0008,0023)

Content Time (0008,0033)

Acquisition DateTime (0008,002A)

Frame 1 Acquisition DateTime (0018,9074)

Frame 1 Reference DateTime (0018,9151)

Frame 1 Acquisition Duration (0018,9220)

Frame i ...

Frame n Acquisition DateTime (0018,9074)

Frame n Reference DateTime (0018,9151)

Frame n Acquisition Duration (0018,9220)

Image Acquisition Duration (calculated)

Acquisition Time Synchronized (0018,1800) = YES * * If Acquisition is synchronized with external time reference

Figure FFF.1.1-1. Time Relationships of a Multi-frame Image​

FFF.1.1.2 Time Relationships of One Frame​

The following figure shows the time-related Attributes of the acquisition of an individual frame "i" and the relationship with the X-Ray​ detector reading time and simultaneous ECG waveform acquisition.​

- Standard -​

Источник: https://studfile.net/preview/14585770/