Материал: 2434
Sample 2
Development and Use of a Multi-color Tracer Technique to Investigate Colloid Facilitated Transport
through Unsaturated Vadose Zone Soil
A novel multi-colored method for tracing several different sizes of colloid at once was developed using fluorescently dyed latex polystyrene microspheres and employing a solvent dissolution method (SDM) developed from that used in bio-medical research for the detection of these tracers. The use of this method means that both the breakthrough characteristics, and colloidal mobilization and deposition patterns within the soil profile, can be investigated as it allows detection of the microsphere tracers in both water and soil samples.
A series of laboratory based rainfall simulation experiments car-
ried out on a four large intact soil cores showed that the four sizes of
ПХuШrОsМОЧt ЦТМrШspСОrО usОН ТЧ tСТs rОsОКrМС (1.βµЦ, 0.8µЦ, 0.4µЦ
КЧН 0.βµЦ) МШuХН ЦТЦТМ tСО ЛОСКЯТШr ШП tСО МШrrОspШЧНТЧР sТгО ПrКc- tions of both TP and MRP extremely successfully, though the correlation was stronger for TP. These experiments also showed that the colloidal and colloid-borne P could make a significant contribution to phosphorus losses from agricultural soils. Further, a high proportion
of all four size fractions were found to be molybdate reactive, indicat-
ТЧР tСКt МurrОЧt аКtОr quКХТtв ЦШЧТtШrТЧР аСТМС usОs MRP<0.45µЦ Кs a measure of bioavailable P in surface waters may result in serious underestimation. The potential impact of phosphorous losses from diffuse sources through unsaturated vadose zone soils on ecological water quality may be considerably greater than previously thought.


 Scan the passage and explain the meaning of the phrases in bold. Then answer some questions about scientific experiments.
The researcher designs experiments to provide evidence in support of the hypothesis. The experiment may involve creating a theoretical model, which may be tested on a computer. Whatever form the experiment takes, the scientist must gather substantial amounts of data. Analysis of the data will either suggest the validity of the hypothesis or encourage revision.
Once revised and retested, the hypothesis must withstand the scrutiny of other scientists as well. They may repeat the experiment to retest the va-
83
lidity of the hypothesis, along with the validity of the methods used to test the hypothesis.
One of the fundamental prerequisites of a healthy scientific method is the quality of experimentation that is designed to test a hypothesis.
Questions:
1.What requirements should the experiment meet?
2.Can you identify any stages in supporting hypotheses?


 A. In pairs suggest ideas about differences between three types of experimental research: laboratory and field experiments, field studies. To check your ideas see the definitions below.
A laboratory experiment is a research study conducted in a contrived setting in which the effect of all, or nearly all, influential but irrelevant independent variables is kept to a minimum.
A field experiment is a research study conducted in a natural setting with some amount of researcher interference, when one or more independent variables are manipulated by the experimenter under conditions controlled as carefully as the situation will permit (contrived setting).
A field study is a research study when various factors are examined in the natural settings in which daily activities are going on as normal with minimal research interference (noncontrived setting).
B.Define the type of experiments in the given below examples.
1.A researcher wants to determine the cause-and-effect relationship between interest rate and the inducements it offers to clients to save and deposit money in the bank. She selects branches within a 60-mile radius for the experiment. For 1 week only, she advertises the annual rate for new certificates of deposit received during that week in the following manner: the interest rate would be 9% in one branch, 8% in another, and 10% in the third. In the fourth branch, the interest rate remains unchanged at 5%. Within the week, she would be able to determine the effects, if any, of interest rates on deposit mobilization.
2.A researcher wants to analyze the relationship between interest rates and bank deposit patterns of clients. She tries to correlate the two by looking at deposits into different kinds of accounts (such as savings, certificates of deposit, and interest-bearing checking accounts) as interest rates changed.
3.A researcher wants to establish the causal connection between interest rates and saving, beyond a doubt. She recruits 40 students who are
84
all business majors in their final year of study. She splits them into four groups and gives each one of them amount of $1,000, which they are told they might utilize to buy their needs or save for the future, or both. She offers them an incentive, interest on what they save but manipulates the interest rates by offering a 6% interest rate on savings for group 1, 8% for group 2, 9% for group 3, and keeps the interest at the lowest rate of 1% for group 4.
C. Here are four statements comparing two types of experiments: laboratory and field (Parasuraman, Grewal, Krishnan, 2004). Can you account for these opinions?
1.Time: field experimentation is more time consuming than laboratory.
2.Cost: field experimentation is more expensive than laboratory.
3.Exposure to competition: a theory tested in the field may allow access by the competition to the idea.
4.Nature of manipulation: some things simply cannot be tested adequately in a laboratory.


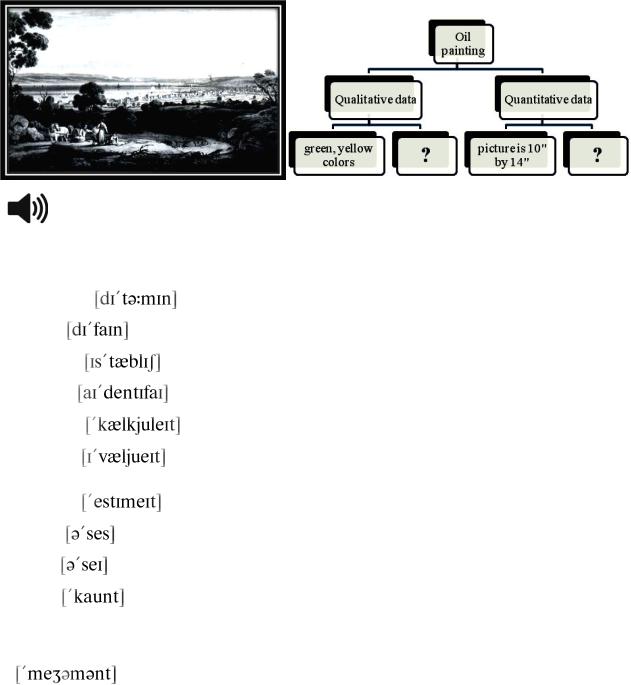
 A. First make a list of data, which scientists usually collect during experiments. Then compare your lists with the information from the table. What data types do your examples belong to? Differentiate between these data types.
Quantitative data |
|
Qualitative data |
Measurable, numeric data includ- |
|
Nonnumeric data, which deals with |
ing quantities, percentages, and sta- |
|
descriptions, can be observed but not |
tistics (length, height, area, vol- |
|
measured (colors, textures, smells, |
ume, weight, speed, time, tempera- |
|
tastes, appearance, etc.) |
ture, humidity, sound levels, cost, |
|
|
members, ages, etc.). |
|
|
|
|
|
Seek to confirm hypotheses about |
|
Seek to explore phenomena. |
phenomena. |
|
|
|
|
|
Use highly structured methods |
|
Use semi-structured methods such as |
such as questionnaires, surveys and |
|
in-depth interviews, focus groups |
structured observation. |
|
and participant observation. |
|
|
|
Used to quantify variations. |
|
Used to describe variations. |
|
|
|
|
85 |
|
Used to predict causal relation- |
Used to describe and explain rela- |
ships. |
tionships. |
|
|
Data format: numerical. |
Data format: textual. |
B. Practise collecting quantitative and qualitative data.


 A. Listen to the speaker and practise pronunciation of phrases
related to scientific experiments: |
|
|
|
determine |
( |
, |
) |
define |
( |
|
) |
establish |
( |
|
) |
identify |
( |
|
) |
calculate |
( |
|
) |
evaluate |
|
( |
), |
estimate |
( |
|
), |
assess |
( |
|
) |
assay |
|
( |
) |
count |
|
|
|
measure 
take measurements (of)
check  test
test  compare
86
B. First study the words in the table (above) and the context below. Then compare the meaning of the words in bold.
1.What were the doses used in assaying the preparation toxicity?
2.The DNA assays are more sensitive than urine cultures for detecting CMV.
3.How did you assess the radiation level?
4.The legal costs have been assessed Кt £75,000.
5.The study will evaluate the long-term effects of exposure to radiation.
6.The evidence should be carefully evaluated.
7.The results of the survey were used to estimate the preferences of the
population at large.
8.We estimated tСО МШst Кt £50,000.
9.We are interested in determining the cost.
10.Computer models help to determine whether a particular area is likely to flood.
11.We have chosen to define the scope of our study quite broadly.
12.It is important to define these terms accurately.
13.We have not yet clearly identified the source of the pollution.
14.All three structures dated to the third century and were tentatively identified as shrines.
15.Townsend's work firmly established the links between unemployment and poverty.
16.The cause of the effect has not yet been established.
17.The sum involved was calculated at $82 million.
18.The program helps you to calculate how much tax you have to pay.


 Work in pairs. Look through a scientific paper and ask each other about experiments in this work. You should start as fol-
lows:
1. HШа НТН tСО КutСШrs НОtОrЦТЧО …? β. HШа НТН tСО КutСШrs ЦОКsurО …? γ. HШа НТН tСО КutСШrs ОstКЛХТsС …?
4.HШа НТН tСО КutСШrs ОЯКХuКtО …?
5.HШа НТН tСО КutСШrs КssОss …?
6.HШа НТН tСО КutСШrs МСОМФ …?
7.HШа НТН tСО КutСШrs НОПТЧО …?
87