Материал: 2434


 A. Study some examples of describing the aim, the object and variables of experiments. Substitute the parts in italics for those
The appropriate concentra tion of the drug is best determined by exper-
iment.
The experiment aimed at cutting road deaths resulting from excessive
speeding.
We decided to try an experiment in single-sex teaching.
We have experimented with different designs of engine.
We experimented successfully on the plants to discover diseaseresistant varieties.
B.Complete the statements with ideas about your research.
1.… Тs КssОssОН ШЧ tСО ЛКsТs ШП …
2.We will make ЦОКsurОЦОЧts ШП … tШ ТЦprШЯО …
3.We concentrate Шur ОбpОrТЦОЧts ШЧ ОбpХШrТЧР …
4.АО МШХХОМt … НКtК ШЧ …
5.We do not look Кt …
6.АО rОprШНuМОН … ТЧ Шur sТЦuХКtТШЧs.
7.We sСКХХ ОбКЦТЧО … tШ ТЧМrОКsО …
8.… sКЦpХОs (ШП …) аТХХ ЛО ТЧЯШХЯОН ТЧ tСО stuНв.
9.InitТКХХв tСОrО аКs/аОrО…, ХКtОr …
10.АО ОбpОМt tСКt …
11.We shall spend much time on an experiment аТtС …
12.I аШЧНОr СШа ШПtОЧ … ЦКв ШММur.related to your investigation.


 A. Study the following description of an experiment and write down a brief report on experiments in your research (50 words).
WО КrО РШТЧР ПТЧН Шut tСО ОППОМt ШП … ШЧ … One simple experiment would be to dissolve … ТЧ … ШП НТППОrОЧt tОЦpОrКturОs КЧН tШ ФООp trКМФ ШП СШа ЦuМС tТЦО Тt tКФОs ПШr … tШ НТssШХЯО. TСТs аШuХН ЛО К test of the
idea that the rate of dissolving varies according to the kinetic energy of the solvent.
We want to make sure to use the exact same amount of … in each trial, and the exact same amount of …. We do this to make sure that the temperature alone causes the effect. It might be, for example, that the ratio of … to … is also a factor in the rate of dissolving. To be extra careful, we
88

might also run the experiment so that the … temperature does not change during the experiment.
This is called "isolating a variable". This means that, of the factors which might have an effect, only one is being changed in the experiment.
We will do the experiment in three trials, which are exactly the same, except for the temperature of the ...
To see results we make a table of them, listing all of the things that changed each time we ran the experiment. If every other part of the experiment was the same, then this would be very good evidence that … affects how fast … is dissolved.
B. Tell your group about the aim of your experiments. Let your groupmates clarify some details.
Examples: |
|
- DШ вШu ОбКЦТЧО … ? |
- DШ вШu (КХsШ) ЦОКsurО … ? |
… КЧКХвгО … ? |
… ХШШФ Кt … ? |
… stuНв …? |
… МШЧsТНОr … ? |
… ЦКФО ЦОКsurОЦОЧts ШП … ? |
… НШ КЧв ОбpОrТЦОЧts Кt … ? |
… МШЦpКrО … ? |
|
… МСОМФ … ? |
|
- HШа НШ вШu КssОss … ? |
- ВШur rОsuХts sСШа …, Лut СКЯО |
… НОtОrЦТЧО … ? |
вШu trТОН … ? |
… НОtОМt … ? |
- ВШu ЦОЧtТШЧОН tСКt …, Лut … ? |


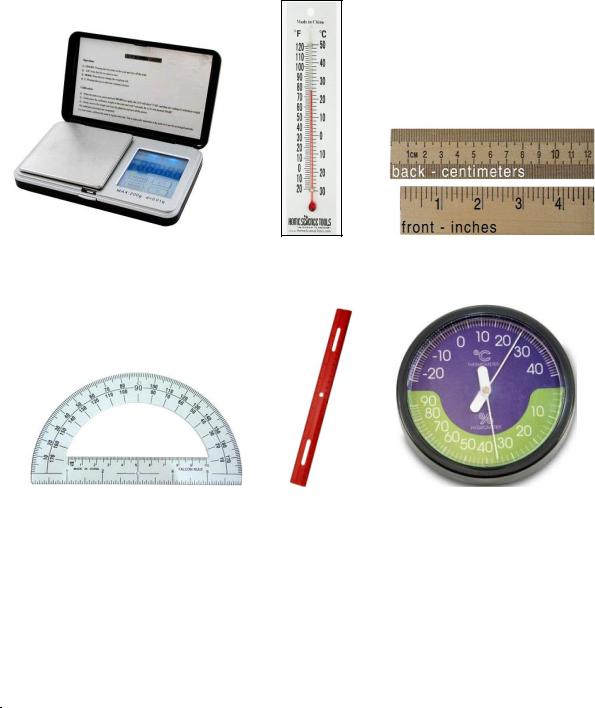
 A. Match the pictures below (pic. 6, a f) and the words from the box. What do these tools measure?
meter stick |
protractor |
ruler |
scale |
hygrometer-thermometer |
thermometer |
|
|
|
|
|
|
89
a |
b |
c |
d |
e |
f |
Pic. 6
B. Do the data in the table match? Make corrections, if necessary.
1. |
Anemometer |
– wind speed (a) |
2. |
Barometer |
– information from respondents (b) |
3. |
Calorimeter |
– heat (c) |
4. |
Dynamometer |
– voltage (d) |
5. |
Oscilloscope |
– air pressure (e) |
6. |
Particle collider |
– electric signal voltage, amplitude, wavelength, |
|
|
frequency, waveform shape/pattern (f) |
7. |
Stopwatch |
– the structure of the subatomic world (g) |
8. |
Theodolite |
– angles, surveying (h) |
9. |
Voltmeter |
– torque (i) |
10. Questionnaire |
– time (j) |
|
|
|
|
|
|
90 |

C. What research tools/methods will you choose in each case?
|
|
a) direct questioning – survey, interview; |
|
|
|
|
|
1. |
Internal |
b) direct measurement/observation – records, tax returns, |
|
|
states |
census data; |
|
|
|
|
|
2. |
External |
c) direct observation – counting, describing, photography; |
|
|
|||
d) reported – survey, interview, social network analysis, |
|||
|
states |
||
|
|
scenario-based interviews, verbal protocols; |
|
3. |
Behavior |
|
|
f) indirect inference – observe behavior in controlled cir- |
|||
|
|
||
4. |
Artifacts |
cumstances; |
|
|
|||
g) indirect observation – self-report; |
|||
|
|
||
|
|
|
|
5. |
Environ- |
h) indirect – self-report, documentary research; |
|
|
ment |
|
|
|
i) direct observation – photography, measurement, map- |
||
|
|
||
|
|
ping, documentary sources, participant observation. |
|
|
|
|


 Tell your group about the aim of your experiments. Let your groupmates guess what tools/methods you apply in your research.


 Scan text B and pick out common mistakes scientists make while performinР tСОir ОбpОrimОnts. Don’t вou tСink вou МКn
repeat some of these mistakes?
The scientific method attempts to minimize the influence of the scientist's bias on the outcome of an experiment. That is, when testing a hypothesis, the scientist may have a preference for one outcome or another, and it is important that this preference not bias the results or their interpretation. The most fundamental error is to mistake the hypothesis for an ex-
planation of a phenomenon, without performing experimental tests. Sometimes “common sОЧsО” КЧН “ХШРТМ” tempt us into believing that no test is
needed. There are numerous examples of this, dating from the Greek philosophers to the present day.
Another common mistake is to ignore or rule out data which do not support the hypothesis. Ideally, the experimenter is open to the possibility that the hypothesis is correct or incorrect. Sometimes, however, a scientist may have a strong belief that the hypothesis is true (or false), or feels in-
91
ternal or external pressure to get a specific result. In that case, there may be a psychological teЧНОЧМв tШ ПТЧН “sШЦОtСТЧР аrШЧР”, such as systematic
effects, with data which do not support the scientist's expectations, while data which do agree with those expectations may not be checked as carefully. The lesson is that all data must be handled in the same way.
Another common mistake arises from the failure to estimate quantitatively systematic errors. There are many examples of discoveries which were missed by experimenters whose data contained a new phenomenon,
but who explained it away as a systematic background. Conversely, there КrО ЦКЧв ОбКЦpХОs ШП КХХОРОН “new discoveries” which later proved to be due to systematic errШrs ЧШt КММШuЧtОН ПШr Лв tСО “discoverers”.
In a field where there is active experimentation and open communication among members of the scientific community, the biases of individuals or groups may cancel out, because experimental tests are repeated by different scientists who may have different biases. In addition, different types of experimental setups have different sources of systematic errors. Over a period spanning a variety of experimental tests (usually at least several years), a consensus develops in the community as to which experimental results have stood the test of time.


 Summarize the passage related to scientific results in one sentence.
An ad hoc analysis is a hypothesis invented after testing is done, to try to explain why the contrary evidence. A poor ad hoc analysis may be seen as the researcher's inability to accept that his/her hypothesis is wrong, while a great ad hoc analysis may lead to more testing and possibly a significant discovery. An interesting example of an apparently supported ad hoc hypothesis was Albert Einstein's addition of the cosmological constant
to general relativity in order to allow a static universe. Although he later referred to it as his “РrОКtОst ЛХuЧНОr”, Тt СКs ЛООЧ ПШuЧН tШ МШrrОspШЧН
quite well to the theories of dark energy.


 Explain the meaning of the phrases in bold. Illustrate them with examples from your own research.
In quantitative research, the amount of data measured can be enormous. Data not prepared to be analyzed is called "raw data". The raw data is often summarized as something called "output data". A cell of the output data is, for example, an average of an effect in many trials for a subject. The output data is used for statistical analysis, e.g. significance tests, to see if there really is an effect. The aim of an analysis is to draw a conclusion, together with other observations. The researcher might generalize the results to a wider phenomenon, if there is no indication of confounding variables “polluting” the results. Researchers also allow the peer review process to check and validate their work.
92