Материал: The_Future_of_Hydrogen-IEA-2020

The Future of Hydrogen |
Chapter 3: Storage, transmission and distribution of hydrogen |
challenging for them to implement. Blending hydrogen into the natural gas infrastructure that already exists would, however, avoid the significant capital costs involved in developing new transmission and distribution infrastructure. Further, if blending were to be carried out at low levels, while it might increase the cost of natural gas delivery to consumers, it would also provide reductions in CO2 emissions. Blending would be considerably easier to implement if steps were taken to clarify existing national regulations on hydrogen in natural gas and to harmonise regulations across borders.
There are almost 3 million kilometres (km) of natural gas transmission pipelines around the world and almost 400 billion cubic metres (bcm) of underground storage capacity; there is also an established infrastructure for international liquefied natural gas (LNG) shipping (Snam, IGU and BCG, 2018; Speirs et al., 2017). If some of this infrastructure could be used to transport and use hydrogen, it could provide a major boost to the development of hydrogen. For example, a blend of 3% hydrogen18 in natural gas demand globally (around 3 900 bcm in 2018) would require close to 12 MtH2. If the majority of this hydrogen came from electrolysers, then this by itself would require around 100 gigawatts (GW) of installed electrolyser capacity (at a 50% load factor), a level that could deliver around a 50% reduction in the capital cost of electrolysers. However, hydrogen blending faces a number of challenges:
The energy density of hydrogen is around a third of that of natural gas and so a blend reduces the energy content of the delivered gas: a 3% hydrogen blend in a natural gas transmission pipeline would reduce the energy that the pipeline transports by around 2% (Haeseldonckx and D’haeseleer, 2007). End users would need to use greater gas volumes to meet a given energy need. Similarly, industrial sectors that rely on the carbon contained in natural gas (e.g. for treating metal) would have to use greater volumes of gas.
Hydrogen burns much faster than methane. This increases the risk of flames spreading. A hydrogen flame is also not very bright when burning. New flame detectors would probably be needed for high-blending ratios.
Variability in the volume of hydrogen blended into the natural gas stream would have an adverse impact on the operation of equipment designed to accommodate only a narrow range of gas mixtures (Abbott, Bowers and James, 2013). It could also affect the product quality of some industrial processes.
The upper limit for hydrogen blending in the grid depends on the equipment connected to it, and this would need to be evaluated on a case-by-case basis. The component with the lowest tolerance will define the tolerance of the overall network.
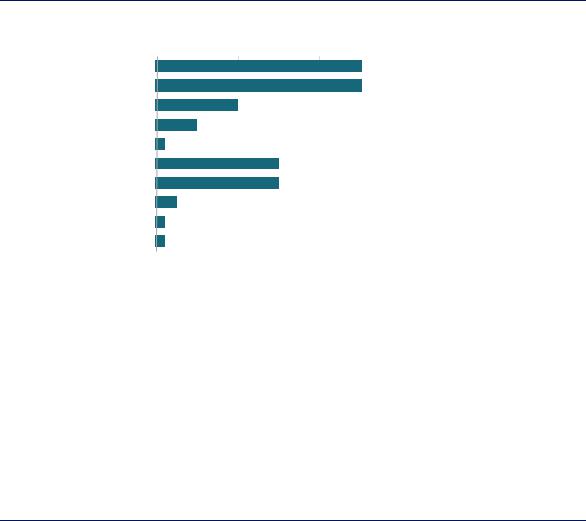
Some existing components along the natural gas value chain have a high tolerance for hydrogen blending (Figure 25). For example, polyethylene distribution pipelines can handle up to 100% hydrogen, and the H21 Leeds City Gate project in the United Kingdom aims to demonstrate the feasibility of delivering hydrogen through the gas distribution network to provide heat for households and businesses. Similarly, salt caverns can store pure hydrogen instead of natural gas without any need for upgrades. Many gas heating and cooking appliances in Europe are certified for up to 23% hydrogen, although the effects of such levels over many years of use are still unclear (Altfeld and Pinchbeck, 2013).
However, there are other parts of the existing natural gas value chain that cannot tolerate high levels of blended hydrogen. The biggest constraint is likely to be in the industrial sector, where many industrial applications have not been certified or assessed in detail for hydrogen blending.
18 All blending percentages in this section are on a volume basis.
PAGE | 71
IEA. All rights reserved.
The Future of Hydrogen |
Chapter 3: Storage, transmission and distribution of hydrogen |
For example, chemical producers using natural gas as a feedstock may need to adjust processes and contracts with natural gas suppliers that stipulate a narrow specification of gas content. The control systems and seals of existing gas turbines are not designed for the properties of hydrogen and can tolerate less than 5% blended hydrogen (ECS, 2015). A similar issue arises for many installed gas engines, where the recommended maximum level of blended hydrogen is 2%. Minor modifications to existing turbines and engines might enable them to handle higher hydrogen blending levels, and new equipment could be specifically designed to cope with higher levels of hydrogen. But such adjustments would take time and money.
Figure 25. Tolerance of selected existing elements of the natural gas network to hydrogen blend shares by volume
& |
|
Distribution* |
|
|
|
|
|
|
|
|
|
|
|
distribution |
|
|
|
|
|
|
|
|
|
|
|
|
|
Transmission |
Gas meters |
|
|
|
|
|
|
|
|
|
|
||
Transmission |
|
|
|
|
|
|
|
|
|
|
|||
|
|
|
|
|
|
|
|
|
|
|
|
||
|
|
Compressors |
|
|
|
|
|
|
|
|
|
|
|
|
|
Underground storage |
|
|
|
|
|
|
|
|
|
|
|
|
|
|
|
|
|
|
|
|
|
|
|
|
|
|
|
Boilers |
|
|
|
|
|
|
|
|
|
|
|
|
use |
Cooking |
|
|
|
|
|
|
|
|
|
|
|
|
|
|
|
|
|
|
|
|
|
|
|||
|
Engines |
|
|
|
|
|
|
|
|
|
|
||
|
End |
|
|
|
|
|
|
|
|
|
|
||
|
Gas turbines |
|
|
|
|
|
|
|
|
|
|
||
|
|
|
|
|
|
|
|
|
|
|
|
||
|
|
CNG tanks* |
|
|
|
|
|
|
|
|
|
|
|
|
|
0% |
20% |
40% |
60% |
80% |
100% |
||||||
Allowable under certain circumstances
* The higher tolerance of CNG tanks is for Type IV tanks (although the tolerance for CNG tanks may be as low as 0.1% depending on the humidity of the natural gas (United Nations, 2014); the higher tolerance for distribution would require specific safety assessments.
Note: CNG = compressed natural gas.
Sources: Altfeld and Pinchbeck (2013), “Admissible hydrogen concentrations in natural gas systems”, Gas Energy http://www.gas- for-energy.com/products/2013-admissible-hydrogen-concentrations-in-natural-gas-systems-1/; Jones, Kobos and Borns (2018), “Geologic storage of hydrogen: Scaling up to meet city transportation demands”, Inter. Journal of Hydrogen Energy; Kouchachvili and Entchev (2018), “Power to gas and H2/NG blend in SMART energy networks concept”, Renewable Energy; Melaina, Antonia and Penev (2013), “Blending hydrogen into natural gas pipeline networks: A review of key issues”, National Renewable Energy Laboratory; Müller-Syring and Henel (2014), “Wasserstofftoleranz der Erdgasinfrastruktur inklusive aller assoziierten Anlagen”, DVGW; Reitenbach, et al. (2015), “Influence of added hydrogen on underground gas storage: a review of key issues”, Environmental Earth Science; Weidner et al. (2016), “Sector Forum Energy Management/Working Group Hydrogen Final Report”.
CNG tanks, turbines and engines have the lowest hydrogen tolerance. Minor adaptations could increase the grid’s tolerance and exploit its transport capacity.
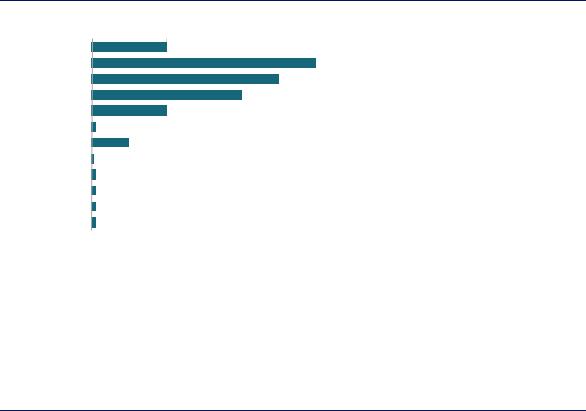
Existing national regulations for gas quality are defined by the elements along the gas value chain that are least able to cope with blending. Many regions specify a maximum of 2% blending, with a few specifying between 4% and 6% (Figure 26). Germany specifies a maximum of 10%, but less than 2% if CNG filling stations are connected to the network. Specifications for certain pieces of equipment can also be restrictive: for example, European standards stipulate that the hydrogen content of natural gas streams must be below 1% for control systems and seals of gas turbines.
Since natural gas is internationally traded, harmonising blend limits across borders is a crucial step to support deployment. Standards should also account for possible variability in hydrogen blending levels over time. In Europe a number of technical committees and industry working
PAGE | 72
IEA. All rights reserved.
The Future of Hydrogen |
Chapter 3: Storage, transmission and distribution of hydrogen |
groups (e.g. HyReady and HIPS-Net) are examining standards for hydrogen blending, while the European Commission is also examining standards and the role of renewable gases and hydrogen in the natural gas network (Eurogas, 2018).
Figure 26. Current limits on hydrogen blending in natural gas networks
Germany* |
|
|
|
|
|
|
|
|
|
Allowable under |
France |
|
|
|
|
|
|
|
|
|
certain circumstances |
|
|
|
|
|
|
|
|
|||
Spain |
|
|
|
|
|
|
|
|
|
|
|
|
|
|
|
|
|
|
|
|
|
Austria |
|
|
|
|
|
|
|
|
|
|
|
|
|
|
|
|
|
|
|
|
|
Switzerland |
|
|
|
|
|
|
|
|
|
|
|
|
|
|
|
|
|
|
|
|
|
Lithuania* |
|
|
|
|
|
|
|
|
|
|
Finland |
|
|
|
|
|
|
|
|
|
|
Netherlands* |
|
|
|
|
|
|
|
|
|
|
Japan |
|
|
|
|
|
|
|
|
|
|
United Kingdom |
|
|
|
|
|
|
|
|
|
|
Belgium |
|
|
|
|
|
|
|
|
|
|
California |
|
|
|
|
|
|
|
|
|
|
0 |
2 |
4 |
6 |
8 |
10 |
|||||
|
|
|
|
|
|
|
% hydrogen (volume) |
|||
* Higher limit for Germany applies if there are no CNG filling stations connected to the network; higher limit for the Netherlands applies to high-calorific gas; higher limit for Lithuania applies when pipeline pressure is greater than 16 bar pressure.
Sources: Dolci et al. (2019), “Incentives and legal barriers for Power-to-Hydrogen pathways: An international snapshot”, International Journal of Hydrogen; HyLaw (n.d.), Online Database; Staffell et al. (2019) “The role of hydrogen and fuel cells in the global energy system”, Energy and Environmental Science.
Today most countries limit hydrogen concentrations in the natural gas network; modifying these regulations will be necessary to stimulate meaningful levels of hydrogen blending.
Keeping track of how much hydrogen has been injected into the grid and its carbon intensity is also important. Such an accounting method – sometimes called a “guarantee of origin” – is essential if operators are to be paid a premium for supplying lower-carbon gas. An example is the system in California whereby some customers can purchase certificates for renewable methane blended into the grid despite the gas molecules themselves being untraceable after injection. In Europe the CertifHy project has designed an operational framework for guarantees of origin and issued more than 75 000 digital certificates.
In addition to issues relating to the grid itself, policies to bring about higher blending levels need to incorporate strategies for replacing equipment in homes, offices and factories. The conversion could be done progressively region by region. Implementing policies of this kind would be time-consuming and costly, but not unprecedented: the United Kingdom, Austria, Germany and the United States switched from town gas (with 50% hydrogen) to natural gas in the 1960s and 1970s. The United Kingdom replaced 40 million appliances at a cost of USD 12 billion over 10 years (Dodds and Ekins, 2013).
There are currently 37 demonstration projects examining hydrogen blending in the gas grid. The Ameland project in the Netherlands did not find that blending hydrogen up to 30% posed any difficulties for household devices, including boilers, gas hobs and cooking appliances (Kippers, De Laat and Hermkens, 2011). Injection has also been tested at both the transmission and distribution level. Other European projects are testing the technical and monitoring requirements of underground storage (Hypos, 2017).
PAGE | 73
IEA. All rights reserved.

The Future of Hydrogen |
Chapter 3: Storage, transmission and distribution of hydrogen |
Hydrogen blending into the natural gas stream could be used to provide a pure stream of hydrogen if it is separated at the end-use site. There are a number of options to do this, but the cost of these technologies and the need to recompress natural gas once the hydrogen is extracted currently makes this a relatively expensive process. One option, pressure swing adsorption, can cost between USD 3/kgH2 and USD 6/kgH2 depending on the blending level and end-use demand (Melaina, Antonia and Penev, 2013).
Overall, hydrogen blending would be likely to increase costs slightly by around USD 0.3/kgH2 to USD 0.4/kgH2, on top of the costs of hydrogen production. This increase arises from the need for injection stations on the transmission and distribution grids, as well as higher operational costs (Roland Berger, 2017).
New hydrogen transmission and distribution infrastructure
A number of new options could be developed to transport hydrogen from its point of production to end users. Like natural gas, pure hydrogen can be liquefied before it is transported to increase its density. However, liquefaction requires hydrogen to be cooled to minus 253°C; if the hydrogen itself were to be used to provide this energy, then it would consume between around 25% and 35% of the initial quantity of hydrogen (based on today’s technologies) (Ohlig and Decker, 2014). This is considerably more energy than is required to liquefy natural gas, which consumes around 10% of the initial quantity of natural gas.
An alternative possibility is to incorporate the hydrogen into larger molecules that can be more readily transported as liquids. Options include ammonia and LOHCs (Box 7).19 Ammonia and LOHCs are much easier to transport than hydrogen, but they often cannot be used as final products and a further step is needed to liberate the hydrogen before final consumption (except in cases where ammonia, for example, can be used directly by the final customer). This entails extra energy and cost, which must be balanced against the lower transport costs.
Our analysis indicates that transmission of hydrogen as a gas by pipeline is generally the cheapest option if the hydrogen needs be transported for distances of less than about 1 500 km. For longer distances, transmission as ammonia or LOHC may well be a more cost-effective option, especially if the hydrogen needs to be moved overseas, even taking into account the costs of converting hydrogen into ammonia or LOHC and back again. For local distribution, pipelines are cost-effective for distributing high volumes of hydrogen over longer distances; in other cases trucks are likely to be the cheaper option.
19 Hydrogen can also be incorporated into other well-established end-use fuels, such as synthetic methane or biofuels (as discussed in Chapter 2), and then shipped in the existing infrastructure for these products and distributed to their existing demand centres, reducing their CO2 intensity. Whether or not this can be cost-effective depends on the trade-off between the higher costs of the additional processing step and the lower costs of using existing infrastructure. See Chapter 4 for further discussion.
PAGE | 74
IEA. All rights reserved.

The Future of Hydrogen |
Chapter 3: Storage, transmission and distribution of hydrogen |
|
|
|
|
Box 7. Advantages and disadvantages of ammonia and LOHCs
Converting hydrogen to ammonia requires energy equivalent to between 7% and 18% of the energy contained in the hydrogen, depending on the size and location of the system (Aakko-Saksaa et al., 2018; Hansen, 2017; Bartels, 2008). A similar level of energy is lost if the ammonia needs to be reconverted back to high-purity hydrogen at its destination (Brown, 2017; Giddey, 2017). Nevertheless, ammonia liquefies at -33°C, a much higher temperature than is the case for hydrogen, and contains 1.7 times more hydrogen per cubic metre than liquefied hydrogen, which means it is much cheaper to transport than hydrogen. While ammonia already has a well-established international transmission and distribution network (see Chapter 2), it is a toxic chemical and this may limit its use in some end-use sectors. There is also a risk that some uncombusted ammonia could escape, which can lead to the formation of particulate matter (an air pollutant) and acidification (Table below).
Making an LOHC involves “loading” a “carrier” molecule with hydrogen, transporting it, and then extracting pure hydrogen again at its destination. LOHCs have similar properties to crude oil and oil products, and their key advantage is that they can be transported as liquids without the need for cooling. However, as with ammonia, there are costs associated with the conversion and reconversion processes involved. These processes would require energy equivalent to between 35% and 40% of the hydrogen itself (Wulf and Zapp, 2018; Reuß et al., 2017). In addition, the carrier molecules in an LOHC are often expensive and are not used up when hydrogen is created again at the end of the process, so need to be shipped back to their place of origin.
Several different LOHC molecules are under consideration, each with various benefits and drawbacks. In this chapter LOHCs refers to methylcyclohexane (MCH), a relatively low-cost option with toluene as the carrier molecule. Around 22 Mt of toluene is currently produced annually (for commercial products), a quantity that could carry 1.4 MtH2 if it were to be used as an LOHC. It costs around USD 400–900 per tonne. However, toluene is toxic and would require careful handling. A non-toxic alternative LOHC is dibenzyltoluene. Although this is much more expensive than toluene today, scaling up could make it a more attractive option in the long run, especially given its nontoxic nature. Methanol and formic acid are other options, but they lead to greenhouse gas emissions if used directly (unless produced with non-fossil sources of carbon).
For both ammonia and LOHCs, effective utilisation of the heat released in the conversion process could increase the efficiency of the value chain and reduce overall costs.
Selected properties of hydrogen carriers
|
|
|
|
|
Liquid hydrogen |
|
|
Ammonia |
LOHC (MCH) |
|
|||
|
|
|
|
|
|
|
|
|
|
|
|
|
|
|
|
|
Conversion |
|
Small scale: High |
|
|
|
High |
|
Medium |
|
|
|
|
|
|
Large scale: Low |
|
|
|
|
|
|
|||
|
|
|
|
|
|
|
|
|
|
|
|
|
|
|
|
|
|
|
|
|
|
|
|
|
|||
|
|
|
Tank storage |
High |
|
|
High |
High |
|
||||
|
|
|
|
|
|
|
|
|
|
|
|
|
|
|
Process and |
|
|
|
Ship: Low |
|
|
|
Ship: High |
|
Ship: High |
|
|
|
technology |
|
Transport |
|
Pipeline: High |
|
|
|
Pipeline: High |
|
Pipeline: High |
|
|
|
maturity* |
|
|
|
Truck: High |
|
|
|
Truck: High |
|
Truck: High |
|
|
|
|
|
|
|
|
|
|
|
|
||||
|
|
|
Reconversion |
High |
|
|
Medium |
Medium |
|
||||
|
|
|
|
|
|
|
|
|
|
|
|
|
|
|
|
|
Supply chain |
|
Medium/high |
|
|
|
High |
|
Medium |
|
|
|
|
|
integration |
|
|
|
|
|
|
|
|||
|
|
|
|
|
|
|
|
|
|
|
|
|
|
|
|
|
|
|
|
|
|
|
|
|
|
|
|
PAGE | 75
IEA. All rights reserved.