Материал: The_Future_of_Hydrogen-IEA-2020
The Future of Hydrogen Chapter 4: Present and potential industrial uses of hydrogen
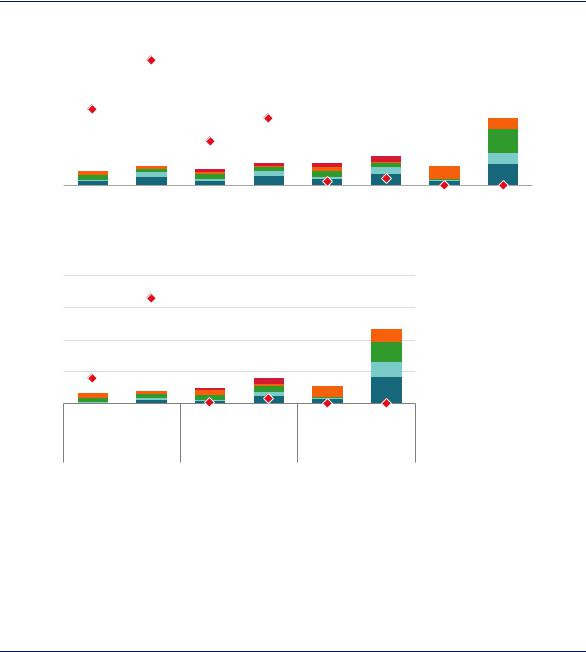
Figure 41. Costs and CO2 intensities for greenfield ammonia and methanol production in 2018
|
2000 |
|
Ammonia |
|
|
|
|
|
|
|
|
|
|
|
4 |
|
|
(USD/t) |
|
|
|
|
|
|
|
|
|
|
|
(tCO |
|||||
|
|
|
|
|
|
|
|
|
|
|
|||||||
|
|
|
|
|
|
|
|
|
|
|
|
|
|
|
|
|
/t) |
|
|
|
|
|
|
|
|
|
|
|
|
|
|
|
|
|
2 |
cost |
1500 |
|
|
|
|
|
|
|
|
|
|
|
3 |
intensity |
|||
|
|
|
|
|
|
|
|
|
|
|
|||||||
|
|
|
|
|
|
|
|
|
|
|
|
|
|
|
|
||
Levelised |
1000 |
|
|
|
|
|
|
|
|
|
2 |
||||||
|
|
|
|
|
|
|
|
|
CO Direct |
||||||||
|
|
|
|
|
|
|
|
|
|
|
|||||||
|
|
|
|
|
|
|
|
|
|
|
|
|
|
|
|
|
2 |
|
500 |
|
|
|
|
|
|
|
|
|
|
|
|
|
1 |
|
|
|
|
|
|
|
|
|
|
|
|
|
|
|
|
||||
|
0 |
|
NG |
Coal |
|
NG |
Coal |
|
NG |
Coal |
|
Electrolysis Biomass |
|
0 |
|
||
|
|
|
|
|
|
|
|||||||||||
|
|
|
|
|
|
|
|
|
|||||||||
|
|
|
|
|
|
w/CCUS |
w/CCUS |
|
w/CCUS |
w/CCUS |
|
|
|
|
|
|
|
|
|
|
Unabated |
|
With conc. capture |
|
With total capture |
|
No net direct emissions |
|
|
|
|||||
Methanol
Levelised cost (USD/t)
1600
1200
800
400
0
4 |
/t) |
|
|
||
|
2 |
|
3 |
(tCO |
|
intensity |
||
2 |
||
|
||
|
2 |
|
1 |
CO |
|
Direct |
||
0 |
||
|
NG |
Coal |
NG |
Coal |
Electrolysis Biomass |
|
|
w/CCUS |
w/CCUS |
|
Unabated |
With total capture |
No net direct emissions |
||
Range
 CCUS costs
 Feedstock
 Fuel
 OPEX
 CAPEX
 Net direct CO2 intensity
Notes: conc. = concentrated; t = tonne. CCUS costs includes the costs of capturing, transporting and storing CO2. Range refers to the range of total levelised costs across regions, with the lower end of the range (the best case for each technology) disaggregated for each technology. It is assumed that the electrolysis route is supplied with 100% renewable electricity, and the source of the biomass in the relevant routes is sustainably procured with no net CO2 emissions. With total capture describes an arrangement where both processand energy-related emissions are captured, whereas With conc. capture describes an arrangement where only process emissions are captured. More information on the assumptions is available at www.iea.org/hydrogen2019.
Source: IEA 2019. All rights reserved.
Low-carbon ammonia and methanol production today is significantly more expensive than production using unabated fossil fuels.
In locations with the lowest cost renewable electricity (for example in Chile, Morocco and China), electrolytic hydrogen would be close to being competitive in cost terms with natural gas and coal for ammonia and methanol production, even if they did not use CCUS. While these locations are some way from today’s centres of demand for these products, they might attract future inward investment, although additional costs for buffer storage and other strategies for coping with the intermittency of variable renewables could raise the costs above those shown in Figure 41. Transporting renewable electricity to the main demand centres is another option, but would also involve additional costs (Box 4 in Chapter 2).
Much of the technology and equipment required for the cleaner pathways in the chemical sector is already in widespread use across the industry, including the pumps, compressors and separation units required for CO2 capture. Electrolysers have been constructed at scales above 100 MW in the past, and significant efforts are being made to bring down their costs further
PAGE | 106
IEA. All rights reserved.
The Future of Hydrogen |
Chapter 4: Present and potential industrial uses of hydrogen |
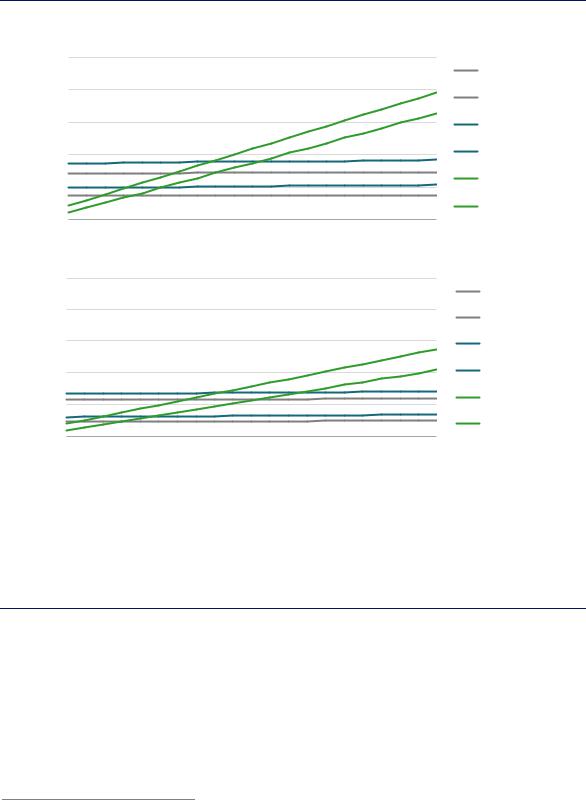
(Chapter 2). The key variables affecting the economics of production via electrolysis and natural gas with CCUS are natural gas and electricity prices (Figure 42).
Figure 42. Variation of ammonia and methanol production costs with fuel price in the long-term
(USD/t) |
1500 Ammonia |
|
|
|
|
|
|
|
|
NG unabated (high) |
|
|
|
|
|
|
|
|
|
|
|
||
|
|
|
|
|
|
|
|
|
|
|
|
cost |
1200 |
|
|
|
|
|
|
|
|
|
NG unabated (low) |
|
|
|
|
|
|
|
|
|
|
||
Levelised |
|
|
|
|
|
|
|
|
|
|
|
900 |
|
|
|
|
|
|
|
|
|
NG w/CCUS (high) |
|
|
|
|
|
|
|
|
|
|
|
||
|
600 |
|
|
|
|
|
|
|
|
|
NG w/CCUS (low) |
|
300 |
|
|
|
|
|
|
|
|
|
Electrolysis (high) |
|
|
|
|
|
|
|
|
|
|
|
|
|
|
|
|
|
|
|
|
|
|
|
Electrolysis (low) |
|
0 |
|
|
|
|
|
|
|
|
|
|
|
0 |
10 |
20 |
30 |
40 |
50 |
60 |
70 |
80 |
90 |
100 |
|
|
|
|
|
|
|
|
Electricity cost (USD/MWh) |
|||
|
Methanol |
|
|
|
|
|
|
|
|
|
|
(USD/t) |
1500 |
|
|
|
|
|
|
|
|
|
NG unabated (high) |
|
|
|
|
|
|
|
|
|
|
||
|
|
|
|
|
|
|
|
|
|
|
|
cost |
1200 |
|
|
|
|
|
|
|
|
|
NG unabated (low) |
|
|
|
|
|
|
|
|
|
|
||
|
|
|
|
|
|
|
|
|
|
|
|
Levelised |
900 |
|
|
|
|
|
|
|
|
|
NG w/CCUS (high) |
|
|
|
|
|
|
|
|
|
|
||
|
600 |
|
|
|
|
|
|
|
|
|
NG w/CCUS (low) |
|
300 |
|
|
|
|
|
|
|
|
|
Electrolysis (high) |
|
|
|
|
|
|
|
|
|
|
|
|
|
0 |
|
|
|
|
|
|
|
|
|
Electrolysis (low) |
|
|
|
|
|
|
|
|
|
|
|
|
|
0 |
10 |
20 |
30 |
40 |
50 |
60 |
70 |
80 |
90 |
100 |
|
|
|
|
|
|
|
|
Electricity cost (USD/MWh) |
|||
Notes: The levelised cost includes the cost of CAPEX on core process equipment, fixed OPEX, fuel and feedstock costs, and the cost of capturing, transporting and storing CO2. Best practice energy performance is assumed for natural gas-based routes. Electrolyser CAPEX range = USD 455–894/kWe. Electrolyser efficiency range = 64–74% on an LHV basis. More information on the assumptions is available at www.iea.org/hydrogen2019.
Source: IEA 2019. All rights reserved.
At low electricity prices, electrolysis is the best option for producing low-carbon ammonia and methanol, but natural gas with CCUS is more competitive at higher electricity prices.
Electrolysis becomes competitive with natural gas with CCUS at electricity prices in the range of USD 15–50/MWh for ammonia and in the range of USD 10–65/MWh for methanol, on the assumption of gas prices of USD 3–10/MBtu.31 In order to compete with natural gas without CCUS at these gas prices, however, electricity prices would need to drop to USD 10–40/MWh for ammonia and USD 5–50/MWh for methanol.
While the upper end of these cost-competitive electricity price ranges show promise for alternative pathways, the economics in most regions are such that policy support is likely to be
31 This assumes that electrolyser CAPEX declines by 50% and efficiency increases by 15%, with no corresponding improvement in the efficiency of natural gas conversion or CCUS.
PAGE | 107
IEA. All rights reserved.

The Future of Hydrogen |
Chapter 4: Present and potential industrial uses of hydrogen |
required in the short to medium term if low-carbon forms of production are to take off. Policy measures could stimulate demand for low-carbon hydrogen in the chemical sector and thus stimulate investment in a cleaner supply of hydrogen. These measures could include the use of certificates, public procurement or portfolio standards to create market value for chemicals produced via low-carbon process routes. In the case of methanol produced as a fuel or fuel additive, this could include the use of fuel specifications or fuel standards (Box 8). Governments could also use standards to support ammonia produced with lower CO2 intensity. In the near term, initial projects that take on value chain and market risks to invest in CCUS or electrolysis hydrogen for chemical production are likely to need some direct government support. The support should be aimed at managing these risks and extending the benefits of cost sharing to other facilities in industrial clusters.
Hydrogen in iron and steel production
DRI is a method for producing steel from iron ore. This process constitutes the fourth-largest single source of hydrogen demand today (4 MtH2/yr, or around 3% of total hydrogen used in both pure and mixed forms), after oil refining, ammonia and methanol. Based on current trends, global steel demand is set to increase by around 6% by 2030, with demand for infrastructure and a growing population in developing regions compensating for declines elsewhere.
Like the chemical sector, the iron and steel sector produces a large quantity of hydrogen mixed with other gases as a by-product (e.g. coke oven gas), some of which is consumed within the sector and some of which is distributed for use elsewhere. Virtually all of this hydrogen is generated from coal and other fossil fuels. To reduce emissions, efforts are underway to test steel production using hydrogen as the key reduction agent (as opposed to carbon monoxide derived from fossil fuels), with the first commercial-scale designs expected in the 2030s. In the meantime, low-carbon hydrogen could be blended into existing processes that are currently based on natural gas and coal to lower their overall CO2 intensity.
How does the iron and steel sector use hydrogen today?
More than three-quarters of global steel demand today is met using primary production methods that convert iron ore to steel, as opposed to the secondary production route, which utilises limited supplies of recycled scrap steel (Figure 43).32 The two main primary production routes already involve some production and consumption of hydrogen.
The blast furnace-basic oxygen furnace (BF-BOF) route accounts for about 90% of primary steel production globally. It produces hydrogen as a by-product of coal use. This hydrogen, contained in so-called “works-arising gases” (WAG), is produced in a mixture with other gases such as carbon monoxide.33 WAG is used for various purposes on site, but also transferred for use in other sectors including power generation and, in China, methanol production. The portion utilised within the iron and steel sector is estimated at 9 MtH2/yr today, or around 20% of the global use of hydrogen in mixed forms (i.e. not as pure hydrogen).
32The remaining demand is met by re-melting steel scrap in an electric arc furnace (EAF). Besides the BF-BOF and DRI-EAF routes, there are other routes currently used for primary steel production, such as the smelt reduction process (in combination with a BOF) and the outdated open hearth furnace route. Together these other routes account for around 1% of primary production.
33Coke oven gas typically contains in the range of 39% to 65% hydrogen by volume, whereas blast furnace gas contains in the range of 1% to 5% (European Commission, 2000). BOF gas is another component of WAG, containing 2% to 10% hydrogen by volume.
PAGE | 108
IEA. All rights reserved.

The Future of Hydrogen |
Chapter 4: Present and potential industrial uses of hydrogen |
The direct reduction of iron-electric arc furnace (DRI-EAF) route accounts for 7% of primary steel production globally. It uses a mixture of hydrogen and carbon monoxide as a reducing agent. The hydrogen is produced in dedicated facilities, not as a by-product. Around threequarters of it is produced using natural gas (reforming) and the rest using coal (gasification). It accounts for around 4 MtH2/yr in 2018, or 10% of the use of hydrogen consumed in mixed forms globally.34
Figure 43. Hydrogen consumption and production in the iron and steel sector today
H2 9 MtH2/yr (by-product)
H2 |
4 MtH2/yr (dedicated) |
|
1 809 Mt/yr total steel production in 2018
Other
H2 |
14 MtH2/yr (by-product) |
Notes: Steel quantities estimated based on recent data from the sources below and stated in Mt/yr. Associated hydrogen consumption and production from IEA estimates based on energy statistics and a specific hydrogen requirement for the DRI-EAF route of 43 kgH2/t of DRI. The 4 MtH2/yr consumed in the DRI-EAF route are used as a reduction agent, whereas the 9 MtH2/yr consumed in the BF-BOF route (and associated processes on integrated sites) are mostly combusted.
Source: World Steel Association (2018), Steel Statistical Yearbook 2018. World Steel Association (2019), “World Crude Steel Production - Summary”.
Today the iron and steel sector accounts for 4 MtH2/yr of dedicated hydrogen production. Of the
14 MtH2/yr it produces as a by-product in hydrogen-containing gases, it consumes roughly 9 MtH2/yr, with the remainder exported for use in other sectors.
Potential for future hydrogen demand for iron and steel
Without policy intervention, demand for dedicated hydrogen production in steel-making is expected to grow from the current level of 4 MtH2/yr roughly in line with the gas-based DRIEAF route (Figure 44).35 While the gas-based DRI-EAF can be more energy-intensive than the BF-BOF route, it uses simpler and slightly less capital-intensive equipment.36 It tends to be deployed in regions with low natural gas prices (e.g. the Middle East) or low coal prices (e.g. India).
34Hydrogen requirements for all DRI-EAF processes considered in this publication are estimates based on personal communication with representatives from Voestalpine and other iron and steel sector experts.
35The future use of the hydrogen contained in by-product WAG will continue to be closely integrated with BF-BOF operation. As such it is not a use of hydrogen that could provide a source of demand for alternative hydrogen supplies, such as electrolytic hydrogen or fossil fuels with CCUS.
36There are other important differences between these routes. In the BF-BOF route, raw material preparation is typically done on site (e.g. agglomeration, lime production), and the process is more flexible in the grades of ore it can accept. The granulated slag produced from the BF-BOF route tends to be of greater utility as a by-product than that produced in the DRI-EAF route. Both routes tend to use some scrap alongside iron ore, but the DRI-EAF tends to use more than the BF-BOF. The energy intensity comparison between the two routes is highly sensitive to site-specific conditions, such as the extent of process integration.
PAGE | 109
IEA. All rights reserved.
The Future of Hydrogen |
Chapter 4: Present and potential industrial uses of hydrogen |
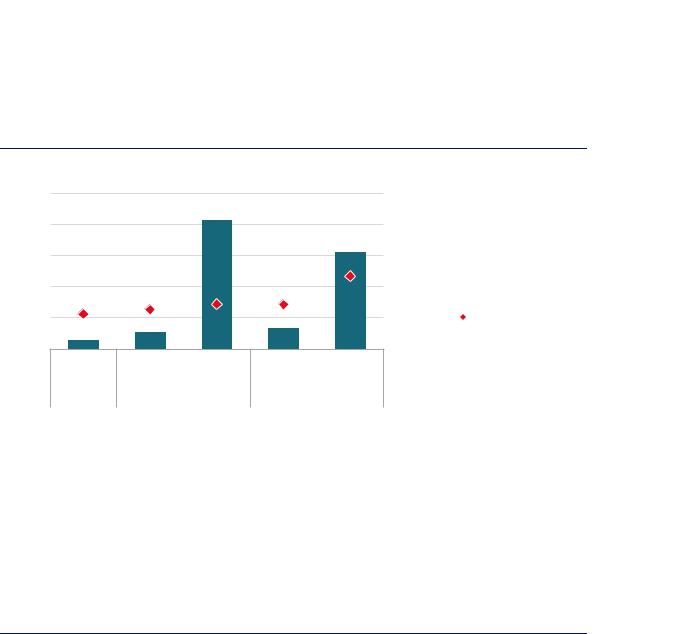
The two main factors to influence future dedicated hydrogen demand for steel production are: the share of the DRI-EAF route in primary steel making, and the split between primary and secondary steel production in overall output. Considering the dynamics of steel stocks in the built environment, on current trends the share of scrap-based production in total steel production is projected to grow from around 23% today to 25% in 2030. In this case, the commercial gas-based DRI-EAF route could supply 14% of primary steel demand. This would require 8 MtH2/yr as a reducing agent (second column of Figure 44), doubling the use of hydrogen for DRI-EAF production from today’s levels. In the same case, if the share of secondary steel production continued to rise (to 29% by 2050) and the gas-based DRI-EAF route was used to satisfy 100% of primary steel demand, hydrogen demand in the sector could theoretically reach 62 MtH2/yr (third column of Figure 12). The two right-hand columns in Figure 12 are described in the next section.
Figure 44. Theoretical potential for dedicated hydrogen demand for primary steel production
MtH2/yr
75
60
45
30
15
0
100%
80%
60%
40%
20%
0%
2018 |
2030 |
2050 |
2030 |
2050 |
|
Current trends to 2030, |
Blending + demo in 2030, |
||
|
100% gas DRI in 2050 100% hydrogen DRI in 2050 |
|||
Share of secondary produciton
Sensitivity of specific hydrogen requirement
 Hydrogen demand
 Share of secondary production
Notes: The 100% gas-based DRI case is one in which the gas-based DRI route grows in line with current trends until 2030, with the 2050 figure showing the theoretical potential if all primary production took place via gas-based DRI. The Blending + demo in 2030, 100% hydrogen DRI in 2050 case is one in which the HYBRIT concept is demonstrated at scale (1.5 Mt/yr) by 2030, and 30% of the feed to the remaining natural gas-based DRI-EAF capacity is substituted with an external hydrogen source. By 2050, the HYBRIT concept accounts for all primary production in this case. In the former case, the share of primary production and overall steel production figures are from a context in which current trends are projected, whereas the latter is one in which action is taken to reach the goals of the Paris Agreement (greater deployment of the secondary route and uptake of materials efficiency strategies). Specific hydrogen requirement assumptions: gas-based DRI-EAF = 43 kgH2/t of DRI; gas-based DRI-EAF with blending = 51-55 kgH2/t of DRI, 23 kg of which could be supplied externally; 100% hydrogen-based DRI-EAF = 47–68 kgH2/t of DRI. 95% DRI charge to the EAF is assumed in all cases. Current DRI-EAF facilities often operate with a higher share of scrap, as this lowers costs.
Source: IEA 2019. All rights reserved.
By 2030 the hydrogen requirement for the DRI-EAF route could more than double. By 2050 the use of this method for all primary production could lead to a 15-fold increase in hydrogen demand.
PAGE | 110
IEA. All rights reserved.