Материал: The_Future_of_Hydrogen-IEA-2020

The Future of Hydrogen |
Chapter 6: Policies to boost momentum in key value chains |
|
|
|
|
Box 19. Realising existing government targets would drive down costs by 2030
Road transport remains a central feature of most hydrogen projects and policies worldwide., with 40% of the water electrolyser capacity in publicly supported energy projects since 2000 being installed to supply hydrogen for buses, commercial fleet vehicles or passenger cars. Several governments have targets for the deployment of FCEVs and hydrogen refuelling stations which, in combination, would mean putting 2.5 million vehicles on the road by 2030, served by 3 500 hydrogen refuelling stations. This would translate into a hydrogen demand of 0.4 MtH2/yr, which is almost as much as two large ammonia plants. These numbers would rise after 2030: Korea alone has a target of nearly 3 million FCEVs (cars, buses and trucks) by 2040 to address air pollution and promote industrial growth (MOTIE, 2019).
If these 2030 targets were realised, the impact on cost reductions would be likely to be dramatic. With 2.5 million FCEVs on the road and 3 500 refuelling stations, analysis suggests that fuel cell costs could be reduced by around 75% and refuelling station capital costs could be halved. The IEA estimates that electrolyser costs could also be cut by around one-third if all this hydrogen were to be supplied by electrolysis. These targets would require a very large increase in hydrogen production and in FCEV numbers, although it would only mean achieving a share of FCEVs in the global road vehicle stock that is half of that occupied by all electric vehicles today, or about 0.2%.
Sources: MOTIE (2019), “Government announces roadmap to promote hydrogen economy”.
Deployment of FCEVs and refuelling stations and official future targets
roadtheonvehiclesThousand |
1 200 |
|
|
|
|
|
|
|
|
stationsrefuellingHydrogen |
1 200 |
|
|
|
|
|
|
|
|
Korea |
|
|
|
|
|
|
|
|
|
|
|
|
|
|
|
|
|||||
|
|
|
|
|
|
|
|
|
|
|
|
|
|
|
|
|
|
|||
|
|
|
|
|
|
|
|
|
|
|
|
|
|
|
|
|
|
|
|
|
|
1 000 |
|
|
|
|
|
|
|
|
|
1 000 |
|
|
|
|
|
|
|
|
Japan |
|
|
|
|
|
|
|
|
|
|
|
|
|
|
|
|
|
|
|||
|
|
|
|
|
|
|
|
|
|
|
|
|
|
|
|
|
|
|
|
|
|
800 |
|
|
|
|
|
|
|
|
|
800 |
|
|
|
|
|
|
|
|
California |
|
|
|
|
|
|
|
|
|
|
|
|
|
|
|
|
|
|
|||
|
|
|
|
|
|
|
|
|
|
|
|
|
|
|
|
|
|
|
|
|
|
600 |
|
|
|
|
|
|
|
|
|
600 |
|
|
|
|
|
|
|
|
Germany |
|
|
|
|
|
|
|
|
|
|
|
|
|
|
|
|
|
|
|||
|
|
|
|
|
|
|
|
|
|
|
|
|
|
|
|
|
|
|
|
|
|
400 |
|
|
|
|
|
|
|
|
|
400 |
|
|
|
|
|
|
|
|
China |
|
|
|
|
|
|
|
|
|
|
|
|
|
|
|
|
|
|
|||
|
|
|
|
|
|
|
|
|
|
|
|
|
|
|
|
|
|
|
|
|
|
200 |
|
|
|
|
|
|
|
|
|
200 |
|
|
|
|
|
|
|
|
France |
|
|
|
|
|
|
|
|
|
|
|
|
|
|
|
|
|
|
|||
|
|
|
|
|
|
|
|
|
|
|
|
|
|
|
|
|
|
|
|
|
|
0 |
|
|
|
|
|
|
|
|
|
0 |
|
|
|
|
|
|
|
|
|
|
|
|
|
|
|
|
|
|
|
|
|
|
|
|
|
|
|
|
||
|
2015 |
2020 |
2025 |
2030 |
2035 |
2015 |
2020 |
2025 |
2030 |
2035 |
||||||||||
Source: AFC TCP (2018), Survey on the Number of Fuel Cell Electric Vehicles, Hydrogen Refuelling Stations and Targets; METI (2019), Strategic Roadmap for Hydrogen and Fuel Cells.
Opportunities to accelerate deployment
Hydrogen-powered vehicles are not cost-competitive today, but have the potential to become much more competitive as production and use rise in line with the targets set by governments, leading to innovation and reductions in costs (Chapter 5). The road transport sector is also the most active area of hydrogen deployment today, with the highest number of projects and policies (Chapter 1). Meeting these targets, however, requires parallel expansion of
PAGE | 186
IEA. All rights reserved.
The Future of Hydrogen |
Chapter 6: Policies to boost momentum in key value chains |
infrastructure for hydrogen supply, vehicle refuelling and vehicle manufacturing (including fuel cells). For investors in each component of the value chain, the risks and costs will be multiplied if there are uncertainties about investment in the other components.
The task for policy makers is to identify which types of vehicle to focus on, and how and where to encourage infrastructure development so that the near-term costs to taxpayers are minimised and the strategic long-term value, in terms of decarbonising transport, is maximised. Fleet vehicles, including taxis, light commercial vehicles and buses, with high daily mileage and freight vehicles with fixed corridor routes are promising opportunities, and could help increase the utilisation rate of refuelling stations on the main routes they use – a key determinant of fuel costs. They could also link with industrial cluster value chains to reduce supply chain risks and foster long-term transport hubs, including for shipping.
Trucks are a source of air pollution, and the stringent air quality standards expected in the future would make hydrogen trucks more attractive. As described in Chapter 5, trucks that have a high mileage and large mass are well-suited to hydrogen, but even the whole global truck fleet, at around 56 million heavyand medium-duty vehicles today, might not be enough units to achieve the needed cost reduction in fuel cells.
Infrastructure deployment strategies will need to be suitable for different fuel cell vehicle types as their markets expand. Once at scale in a given region, hydrogen infrastructure built for the transport sector can be a stepping stone to using hydrogen for flexible power generation, for example. One strategy would be to incentivise the addition of hydrogen refuelling along key transport corridors, given that a relatively small number of the world’s busiest highways carry a lot of its commercial traffic: the Beijing-Hong Kong-Macau Expressway, Germany’s Autobahn 7 near Hamburg, Highway 401 in Canada and the I-405 in Los Angeles in the United States carry a combined total of around 1 million cars and trucks per day. Another approach would be to start with truck fleets that operate out of coastal industrial hubs, helping to concentrate and scale up initial investment in hydrogen supply.
Because city-level governance will play a critical role in supporting the deployment of both hydrogen vehicles and infrastructure in urban areas, all levels of government need to work closely together so that clusters and inter-city corridors can be selected to intersect with the cities where hydrogen transport is likely to prosper first. California’s Zeroand Near ZeroEmission Freight Facilities Project and Germany’s H2Mobility initiative show different approaches to this challenge.
Near-term policy priorities
Targets and/or long-term policy signals. Official targets for FCEVs and hydrogen refuelling station deployment exist in at least 18 countries and regions. Others might consider following their example. These targets need to be firmly situated within a robust strategy for transport overall, which should identify the priorities for hydrogen FCEVs alongside BEVs and other transport modes. Long-term transport strategies can encompass aviation, rail and shipping too.
Demand creation. Overarching policy frameworks such as fuel economy standards, renewable fuel obligations and low-carbon fuel standards should include all types of hydrogen supply and value them in accordance with life-cycle emission reductions, alongside other technology options. While non-financial incentives like zero-emission cities and priority lanes, zones and parking spaces can help, significant consumer demand will not materialise without a range of available vehicles at acceptable prices, together with predictable and affordable fuel prices. Initially this is likely to require direct purchase subsidies, tax credits and other measures such as
PAGE | 187
IEA. All rights reserved.
The Future of Hydrogen |
Chapter 6: Policies to boost momentum in key value chains |
fuel price guarantees from suppliers or governments. Policy makers may choose to offer more attractive levels of support where large equipment orders can be secured for large fleets or networks of refuelling stations, or give incentives to capitalise on the existing refuelling infrastructure along corridors.
Investment risk mitigation. Public policy may need to manage investment risks arising from uncertain supply chains to avoid higher capital costs and hydrogen prices than necessary. For example, a share of electrolyser or refuelling station capacity could receive guaranteed revenue for a limited period, as in California. As has been the case for batteries, clarity over whether electrolysers will be exempt from grid fees, taxes and levies, and under what circumstances, will be important in many markets. Cross-border co-operation to maximise synergies in hydrogen deployment would also help to reduce investment risk.
R&D, strategic demonstration projects and knowledge sharing. Publicly funded research efforts might focus primarily on key cost components, such as fuel cell durability and recycling, on-board storage options and electrolyser efficiency, as well as on earlier-stage technologies likely to be important for shipping and aviation, including use of ammonia in ships, lower-cost means of sourcing “low-carbon” CO2 and producing synthetic fuels. Demonstration projects involving multiple supply chain partners are likely to be valuable, particularly if focused on the use of intermediate storage to manage variable hydrogen supply streams; the capabilities of hydrogen vehicles such as buses, taxis and delivery vehicles; and safety regulations in jurisdictions where these do not exist for hydrogen value chains.
Harmonising standards, removing barriers. The harmonisation of standards across regions and ideally at global level would help to stimulate cost reductions. Among other things, standards are needed for refuelling nozzles for vehicles; hydrogen supply pressures; refuelling station permitting; and safety protocols for high-pressure hydrogen and liquid hydrogen transport by trucks. There is also a case for looking at whether current limitations on the use of hydrogen vehicles on bridges and in tunnels could safely be amended. UNECE Global Technical regulation 13 and various ISO committees are currently exploring several of these issues.
4. The first shipping routes: Kick-start international hydrogen trade
Shipping hydrogen between countries could emerge as a key element of a future secure, resilient, competitive and sustainable energy system. Investment in infrastructure, ships, standards and supply chain companies will have the most impact if located in regions with the greatest potential for hydrogen imports and exports. They are unlikely to happen on a large scale without multilateral co-operation between interested governments.
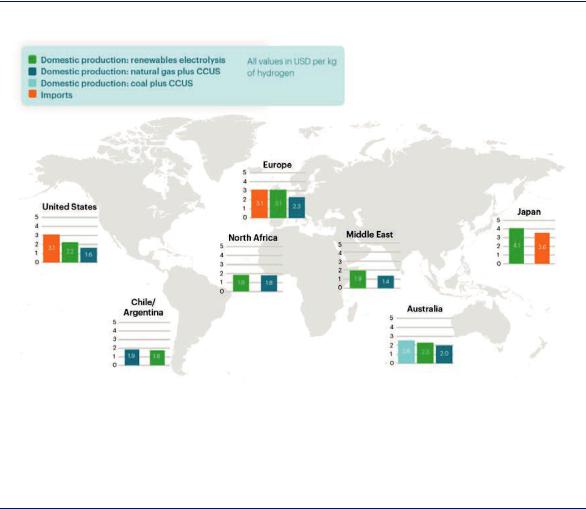
The cost of hydrogen production varies between regions, with Europe and Japan having relatively high costs and also strong policy support for hydrogen (Figure 68). Hydrogen importers stand to benefit from cheaper low-carbon energy, especially if their domestic renewable energy, nuclear or CCUS resources are challenging or expensive to develop. Hydrogen imports can help maintain energy security in a low-carbon future. Exporters stand to generate new sources of economic value based on clean energy resources. Africa has the potential to produce (for both domestic and export) around 500 MtH2/yr at less than USD 2/kgH2, while Chile alone could produce 160 MtH2/yr at this cost. The Middle East could produce over 200 years of current hydrogen demand at USD 1.3/kgH2 from known gas reserves that could be combined with CCUS.
PAGE | 188
IEA. All rights reserved.
The Future of Hydrogen |
Chapter 6: Policies to boost momentum in key value chains |
Figure 68. Routes for hydrogen trading with long-term costs compared to domestic production.
Notes: This map is without prejudice to the status of or sovereignty over any territory, to the delimitation of international frontiers and boundaries and to the name of any territory, city or area. Production cost reflects long-term potential (i.e. low CAPEX for wind and solar, see Chapter 2). Electrolysis considers dedicated wind and solar production.
Source: IEA 2019. all rights reserved.
Multiple opportunities exist for international hydrogen trading routes, which could contribute to energy diversification and security, particularly in Europe and Japan.
International trade in energy products takes time to develop. Globally, LNG imports today are around 400 bcm, 10% of global natural gas demand, and Australia and Qatar supply almost 55% of the LNG market. They did not reach these export volumes overnight. Australia’s first LNG shipments were 30 years ago in 1989, 10 years after signing the first contract. Qatar’s first LNG shipments were in 1997, when globally traded volumes were around one-third of current levels. Overall, it has taken 60 years for global liquefaction capacity to reach the point where 31 liquefaction terminals can now process a total volume of LNG equivalent to Japan’s annual primary energy supply, which can be received at 140 receiving terminals around the world. To date there have been no shipments of pure hydrogen, although there is a routine sea trade in ammonia (equivalent to around 3 MtH2/yr).
Potential hydrogen trade in Asia Pacific in 2030
Japan, Korea and China are world leaders in hydrogen development and all have ambitious targets for 2030 (Table 13 and Box 20). They are also the three largest LNG importers today, together representing 55% of the global market. Each country sees hydrogen as a means of managing environmental concerns without weakening energy security. All three countries are targeting hydrogen use in vehicles; Japan and Korea also have plans for hydrogen use in stationary applications. At 300 MW installed, Korea has one of the largest markets for stationary fuel cell applications, with ambitious plans to expand this to 3.5 GW
PAGE | 189
IEA. All rights reserved.

The Future of Hydrogen |
Chapter 6: Policies to boost momentum in key value chains |
by 2030. Japan has major plans for imported hydrogen in power generation, reflecting the potential for imported ammonia to be co-fired in existing power plants to reduce CO2 intensity.
Table 13. |
Hydrogen demand and supply in Asia Pacific from national and regional roadmaps, 2030 |
|||||||||||||||
|
|
|
|
|
|
|
|
|
|
|
|
|
|
|
|
|
|
Country |
|
|
|
|
Plans by 2030 |
|
|
|
|
|
Notes |
|
|||
|
|
|
|
|
|
|
|
|
|
|
|
|
|
|
|
|
|
|
|
|
Hydrogen |
|
Transport |
|
Power |
|
|
|
Residential |
|
|
|
|
|
|
|
|
flow |
|
|
generation |
|
|
|
|
|
|
|
||
|
|
|
|
|
|
|
|
|
|
|
|
|
|
|
||
|
|
|
|
(MtH2/yr) |
|
(thousand |
|
(GW) |
|
|
|
(million |
|
|
|
|
|
|
|
|
|
vehicles) |
|
|
|
|
homes) |
|
|
|
|
||
|
|
|
|
|
|
|
|
|
|
|
|
|
|
|
||
|
|
|
|
|
|
|
|
|
|
|
|
|
|
|
|
|
|
Australia |
|
|
0.5 |
|
|
|
|
|
|
|
|
|
|
Australia’s strategy is likely to be |
|
|
|
|
|
|
|
|
|
|
|
|
|
|
led by exports. |
|
||
|
|
|
|
|
|
|
|
|
|
|
|
|
|
|
|
|
|
|
|
|
|
|
|
|
|
|
|
|
|
|
|
China’s strategy focuses on |
|
|
China |
0.2 |
|
1 000 (cars) |
|
|
|
|
|
|
|
matching domestic supply with |
||||
|
|
|
|
|
|
|
|
|
|
|
|
|
|
|
domestic demand. |
|
|
|
|
|
|
|
|
|
|
|
|
|
|
|
|
|
|
|
|
|
|
|
|
|
|
|
|
|
|
|
|
|
Demand mostly for power |
|
|
Japan |
|
|
|
|
800 (cars) |
|
|
|
|
|
|
|
|
generation. Demand from |
|
|
|
|
0.3 |
|
|
1 |
|
|
|
5.3 |
|
|
transport is around 0.15 MtH2/yr |
|
||
|
|
|
|
1.2 (buses) |
|
|
|
|
|
|
|
|||||
|
|
|
|
|
|
|
|
|
|
|
|
|
|
and expected to be satisfied |
|
|
|
|
|
|
|
|
|
|
|
|
|
|
|
|
|
|
|
|
|
|
|
|
|
|
|
|
|
|
|
|
|
|
domestically. |
|
|
New |
|
|
|
|
|
|
|
|
|
|
|
|
|
Taranaki proposes exporting |
|
|
Zealand |
|
|
|
|
|
|
|
|
|
|
|
|
|
||
|
0.7 |
|
|
|
|
|
|
|
|
|
|
around 0.3 MtH2 (0.5-1 GW), or |
||||
|
(Taranaki |
|
|
|
|
|
|
|
|
|
|
|||||
|
|
|
|
|
|
|
|
|
|
|
|
|
40% of production. |
|||
|
only) |
|
|
|
|
|
|
|
|
|
|
|
|
|||
|
|
|
|
|
|
|
|
|
|
|
|
|
|
|
|
|
|
|
|
|
|
|
|
|
|
|
|
|
|
|
|
||
|
Korea |
|
|
0.2 |
|
630 (cars) |
|
3.5 |
|
|
|
|
|
|
The target for power is for fuel |
|
|
|
|
|
150 (trucks) |
|
|
|
|
|
|
|
cells, not necessarily hydrogen |
|
|||
|
|
|
|
|
|
|
|
|
|
|
|
|
|
|
||
Sources: Commonwealth of Australia (2018), Hydrogen for Australia's Future; Ministerial Council on Renewable Energy, Hydrogen and Related Issues (2017), Basic Hydrogen Strategy; Venture Taranaki (2019), Hydrogen Taranaki Roadmap.
While China’s focus is currently on the local supply of hydrogen for transport in ten worldscale urban centres for zero-emission vehicles, it could well be a future participant in international hydrogen trade. India has active research projects on hydrogen production, storage and end uses, although it does not yet have any major demonstration projects. Australia is already the largest LNG exporter in the region, with established trade links with other Asian countries. It has large coal and renewable resources that could be converted to low-carbon hydrogen to meet rising demand from Japan and Korea. Australia is still developing its national Hydrogen Strategy, but is likely to prioritise developing an export market over significant domestic use in the near term. One study estimates that hydrogen exports could contribute USD 1.2 billion and provide 2 800 jobs in Australia by 2030 (Commonwealth of Australia, 2018). New Zealand is also looking at possible export markets and has estimated that 0.7 MtH2/yr could be produced from renewable electricity by 2030, with 0.3 MtH2/yr available for export (Venture Taranaki, 2018). New Zealand also signed a memorandum of co-operation with Japan in 2018 to develop and expand hydrogen exports, while Singapore is looking into the feasibility of hydrogen imports.
PAGE | 190
IEA. All rights reserved.