Материал: Крючков Фундаменталс оф Нуцлеар Материалс Пхысицал Протецтион 2011
uncertainty of the high-level standard value and the statistical error of multiple measurement results.
The qualified standard material is a material specimen qualified by a special procedure and provided with a certificate showing the uncertainty of its parameter values. Specimens of qualified standard materials are distributed to operators for MC.
Operator metrology control includes:
∙initial qualification of equipment;
∙periodic requalification (adjustment) and recalibration;
∙regular tests using standards.
Standards are also measured because product batch control is based largely on measurements of the standard. Measurement results are expected to be within the limits of the standard data uncertainty. Control charts (statistical control charts) are used for analysis.
Quality control is also critical to error estimations. The following input sources are used to estimate errors as discussed above:
∙manufacturer specifications;
∙case study results;
∙industry-specific operating criteria;
∙calibration data;
∙metrology control data;
∙interlaboratory comparison data.
The last four of these data sources relate directly to measurement quality control programs.
We shall discuss measurement quality control procedures for some of the techniques.
Weighing
Despite the simplicity of the procedure and quite a minor error involved in a single measurement, weighing, the basic measuring procedure in NM accounting and control systems, needs to be carefully controlled. The minimum required scope of control suggests the following procedures:
∙frequent operator checks using standards;
∙periodic inspection, maintenance and recalibration of all scales and weights;
∙independent reweighing of material in process;
∙monitoring of ambient conditions.
211
Ambient conditions (air temperature, humidity and pressure in the given case) are monitored because weighing process needs the buoyancy acting on the container (depends on the above parameters) to be taken into account.
Sample taking
As mentioned, sample taking procedures can occasionally contribute greatly, if not decisively, to the cumulative error which is due to complicated control of the sample taking process. Normally, sample taking quality control includes the following procedures:
∙testing of sample mixing and taking when establishing work procedures for the sampling free of systematic error;
∙periodic replication of sample taking using independent procedures to check if sample taking involves a systematic error;
∙analysis of independent replicated samples to estimate and analyze the cumulative sample taking error.
Destructive analyses
Destructive analyses, primarily alpha spectrometry and mass spectrometry, are highly complex and time-taking procedures requiring highly skilled personnel to perform. Given that destructive analyses necessarily involve sample taking, the quality of these procedures is equally essential and hard to control. Let us describe a number of regular procedures to control destructive analyses:
∙calibration and standardization of all instruments and reagents;
∙analysis of standard specimens that simulate specimens in process to estimate systematic bias;
∙independent resampling of the material in process and analysis of the sample to estimate the cumulative random sampling and analysis error;
∙iterative sample analysis to estimate the random analysis error;
∙documentation and description of all measurement techniques;
∙training and advanced training of personnel.
Nondestructive assays (NDA)
Nondestructive measurements (NDA) are much easier to perform than destructive ones. However, it is rather hard to control quality of NDA in some cases [7]. In the first place, this stems from the requirement to use standards and standard specimens. Note that a representative NDA standard
212
is sometimes very hard to make (say, to measure deposition in piping or containers with low-level waste). If the properties of the standard and the material analyzed differ greatly, the standard may be a major source of measurement error.
On the whole, any nondestructive measurement quality control program is very similar to such programs for other measurement procedures and includes:
∙calibration;
∙periodic measurements of standards;
∙timely recalibration of standards;
∙qualification of techniques and laboratories;
∙documentation and description of techniques;
∙personnel training.
Control of internal measurements built in the instrument software is a common way to make it easier for operators to perform procedures and improve measurement quality. This suggests automatic check of each measurement.
Thus, MGA, a plutonium isotopic composition nondestructive measurement code, incorporates the following control procedures;
∙control of the detector resolution (if the peak width is in excess of a certain value, the code will not handle the spectrum or will generate the message of a potential error);
∙control of the peak positions in the spectrum;
∙consideration and introduction of an allowance for the measurement system’s dead time;
∙consideration of the 241Pu– 237U nonequilibrium condition in plutonium isotope measurements.
Control charts (statistical control charts)
The control chart is an essential statistical quality control tool. The idea of the control chart is believed to be conceived by W. Shewhart, a US statistician. Control charts were originally used to record measurement data for the required (controlled) product properties [9]. A parameter falling out of the tolerance field indicated to the requirement of having the production process adjusted. Charts also helped one be aware of the cause of the defect. In this case, however, a decision to make an adjustment was taken when the defect had already occurred. Therefore, it was critical to find the procedure to accumulate information not just for a retrospective study but, as well, for decision-making applications. The procedure to obtain
213
cumulative charts and use them in decision-making was proposed by statistician I. Page in 1954.
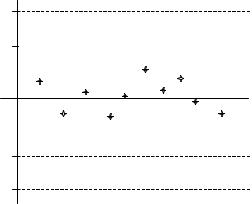
A control chart normally consists of a center line (CL) representing the given value of the characteristic of interest, two control limits (the upper control limit (UCL) and the lower control limit (LCL)) and the points representing the values of the characteristic under control.
An example of a control chart is given in Fig. 4.5. The points in the diagram indicate the measurement results for the controlled parameter of the process, the mean of the characteristic, the inventory difference value, etc. If any point in the diagram is beyond the control limits, this indicates that the process “is not in control”. Besides, if e ven all results fall within the control limits but however, trends or other nonrandom data patterns are observed, this indicates that an additional study is required to avoid more serious errors.
3σ |
|
2σ |
|
0 |
Дата |
|
Data |
-2σ -3σ
Fig. 4.5. Example of a control chart
That the process “is not in control” may be so sign aled by:
∙a point falling beyond the control limits;
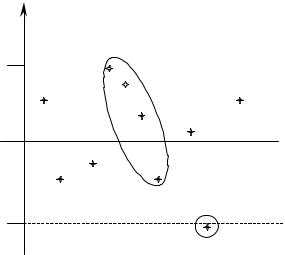
∙a group of consecutive points positioned near rather than beyond one control limit;
∙points scattered heavily in the control chart relative to the center (indicates to an accuracy decrease).
We shall discuss just some of the most common types of control charts: the so-called Shewhart charts and cumulative sum charts.
214
Shewhart charts
The calculation and plotting of a Shewhart chart has the following pattern: let Y1,…, Yn be a set of values for the random quantity Y; μY is the mean value for this sample; and σY is the mean’s standard deviation, then
UCL = μY + 3σ Y , |
(4.75) |
CL = μY , |
|
LCL = μY − 3σ Y . |
|
Fig. 4.6 presents an example of a control chart.
Yi
3σ |
UCL |
CL
-3σ |
LCL |
Fig. 4.6. A Shewhart control chart
In a general case, the random quantity Y may have any distribution, from which the control limits should be chosen. So, the mean sample value has normal distribution with the number of defective elements in the sample having a binomial and the event count rate (events per unit of time) a Poisson distribution (Table 4.9).
215