Материал: Крючков Фундаменталс оф Нуцлеар Материалс Пхысицал Протецтион 2011
compositions of plutonium in the spent fuel of some reactors are given in Table 5.1.
|
|
|
|
|
|
|
Table 5.1 |
|
Isotopic composition of plutonium in power reactor fuels |
|
|
||||||
|
|
|
|
|
|
|
|
|
Reactor |
Fuel burnup, |
|
Isotopic composition, % |
|
|
|||
(GW×day/t) |
239Pu |
|
240Pu |
241Pu |
|
242Pu |
|
|
AGR |
18.0 |
53.7 |
|
30.8 |
9.9 |
|
5.0 |
|
RBMK |
20.0 |
50.2 |
|
33.7 |
10.2 |
|
5.4 |
|
BWR |
27.5 |
59.8 |
|
23.7 |
10.6 |
|
3.3 |
|
PWR |
33.0 |
56.0 |
|
24.1 |
12.8 |
|
5.4 |
|
The isotopic composition of NM is known to determine the properties thereof. The following depends on isotopic composition:
∙critical mass;
∙generation of spontaneous-fission neutrons which influence the
design and power of explosives. For plutonium, the number of these depends directly on the concentrations of 240Pu and 242Pu;
∙generation of heat (for plutonium, this depends directly on the concentration of 238Pu);
∙radiation.
The NM chemical form is what defines to a great extent the choice of measurement techniques and the measurements results. The mass fraction of nuclear material varies in a sample depending on the oxidation level, this to be taken into account when analyzing the weighing result.
Nuclear material is subject to categorization. The category of nuclear material is a quantitative characteristic thereof in the context of NM accounting and control. The category of the onsite nuclear material defines the requirements to the accuracy of test measurements for the NM balance closing (relative standard percent deviations from the inventories) (see Table 5.2).
Errors of NM test measurement results are of a fundamental importance. For example, no loss or theft of less then 150 g of plutonium can be detected when the mass of a 10-kg plutonium sample is determined with an accuracy of 0.5% in the confidence interval of 68% (or 1.5% in the confidence interval of 99%).
221
|
|
Table 5.2 |
|
|
Requirements to the accuracy of NM measurements |
||
|
|
|
|
No. |
Facility type |
Relative standard |
|
|
deviation, % |
|
|
|
|
|
|
1 |
Uranium enrichment |
0.2 |
|
|
|
|
|
2 |
Chemical transformations: uranium |
0.3 |
|
|
conversion and fuel fabrication |
|
|
|
|
|
|
3 |
Plutonium conversion and fuel fabrication |
0.5 |
|
|
|
|
|
4 |
Chemical treatment of uranium |
0.8 |
|
|
|
|
|
5 |
Chemical treatment of plutonium |
1.0 |
|
|
|
|
|
6 |
Isolated scrap* storage |
4.0 |
|
|
|
|
|
7 |
Isolated waste storage |
25 |
|
|
|
|
|
* Scrap – NM reject removed from process for treatme nt.
The nuclear material balance is the result of comparing the book inventory of nuclear material against its inventory in the material balance area (MBA).
The quantity of nuclear material in each MBA shall be determined by measuring the quantity and composition of nuclear material, controlled through accounting and checkouts of nuclear material and verified by physical inventory takings. The final step in a physical inventory taking is balance closing for each nuclear material over the period between the previous and the given physical inventory taking, and determination of the inventory difference and the error thereof.
Physical inventories for each MBA are taken on a periodic basis with the material balance periods (BP) established depending on the category of the nuclear material in the MBA, as well as on the process and other sitespecific features.
An anomaly in accounting and control of nuclear material is as a shortage (a surplus) of nuclear material, errors in accounting records and reports, damage or failures of NM access controls, and breaches in NM fabrication, utilization and transfer procedures.
The measurement program shall be developed for each MBA, this to include the list of measurement techniques, samplers and sampling procedures, measurement frequency data, the required measurement accuracy and the measurement data submission dates and forms.
222
Measurement procedures are subject to metrological certification as required by effective state or industry standards.
Standard samples (standards) used to calibrate instrumentation and check the measurement data accuracy are subject to metrological certification under requirements of effective state or industry standards and shall have the respective certificate.
Each enterprise shall develop and put into operation a measurement quality control program to be part of the NM measurement system. The objective of the program is to ensure the quality of measurements.
The technique to control NM is chosen given the properties of the material and the measurement conditions: physical state, purity, desired accuracy of determination, time required to perform an analysis, number of analyses (1 per month, 100 per week), volume of the analyzed sample, available equipment and standards, qualification of personnel and the funding allocated.
A note should be made that NM test measurements are not direct: the mass of material or its isotopic composition is found from results of measuring the electrical pulse count rate, current variations, spring deformation and so on. The measured effect (N) and the quantity sought for (F) relate through the coefficient k, which is obtained via calibration by measuring standards (NM samples with the known characteristics Fst) on a test measurement bench: k = Fst / Nst, where Nst is the measured effect for the standard.
The accuracy of NM mass determination depends on the test measurement error and the uncertainty of the calibration factor k, the second component prevailing in many cases. In turn, the test measurement data normally needs to be corrected to account for a number of influencing factors caused by specific features of the NM sample, information distortions in the electronic measuring channel and so on.
The NM balance equation has the following form: ID=BI+R– S–EI, where ID is the inventory difference; BI is the book inventory; R is the NM received for storage over the period between the inventory takings; S is the NM shipped over the same period, and EI is the ending inventory of NM. EI = k×N, where N is the number of counts and k is the calibration factor that relates the quantity to be determined to the measurement result.
The judgments on the inventory taking result are made by comparing ID and 3 ID.
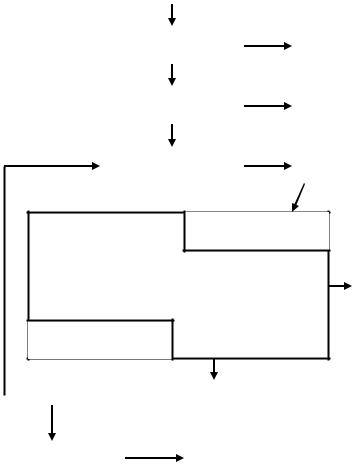
Different stages of a nuclear fuel cycle (Fig. 5.1) deal with different physical and chemical forms of NM and involve loss of NM. Different
223
physical and chemical forms of NM require various measurement technologies for accounting of material. In addition to control of the NM presence and integrity, NM measurement data serves to control processes, as well as to ensure nuclear and radiation safety standards. Measurement procedures and devices are selected so that to provide a comprehensive solution to all of the tasks listed herein.
Therefore, subject to measurement is nuclear material in different states and forms, combined diversely with other material and having different activity levels. Accordingly, these tasks require different techniques and equipment to be accomplished.
Supervision with respect to accounting for and control of NM involves two measurement types:
∙accounting measurements – quantitative characterization of NM and products the results whereof are entered on accounting records;
∙verifying measurements – measurements the results whereof are used to verify the quantitative characteristics or attributes of NM or items.
Test measurements have the purpose of determining the numerical value of the NM quantity. These seek to ensure the best accuracy of the result. There is however a number of control tasks that require only quality data of samples. These include:
∙characterization of unlabeled or erroneously labeled samples;
∙determination of the NM presence in samples on a “y es or no”
basis;
∙rapid inventory taking;
∙verification of the shipper data by the reeiver, etc.
224
Ore mining |
|
|
|
|
Ore processing |
|
|
|
Treatment |
|
|
|
into UF6 |
|
|
|
|
|
|
|
Uranium |
|
Gas-diffusion, |
enrichment |
|
centrifugal, laser |
|
|
|
|
|
|
Pelletfabrication |
|
FA |
|
fabrication |
|
|
|
|
|
|
|
Fresh FA
storage
Power |
NPP |
|
generation |
||
|
Spent FA starage
|
|
|
|
Spent fuel treatment |
|
|
|
|
|
||
|
|
|
|
|
|
|
|
|
|
|
|
|
Radwaste |
|
Waste |
||
|
processing |
|
storage |
||
|
|
|
|
|
|
Fig. 5.1. Flowchrt of NM transformations in a fuel cycle
225