Материал: Крючков Фундаменталс оф Нуцлеар Материалс Пхысицал Протецтион 2011
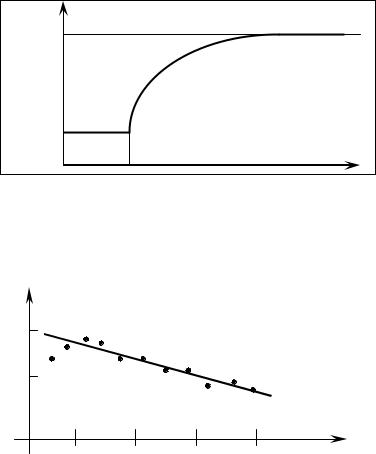
thermostat chamber for the sample helps reach the equilibrium in several times as fast.
To determine the power generated by the sample in the thermostat from the measured potential difference, a sensitivity diagram is normally used.
Equilibrium value |
Bridge voltage, V |
Time, h |
Fig. 5.24. Time-dependent voltmeter indications
To this end, a curve for the thermostat sensitivity to the samplegenerated power is plotted. Fig. 5.25 shows a calorimeter sensitivity diagram option.
V/W |
|
|
|
S, |
|
|
W, W |
|
|
|
|
10 |
20 |
30 |
40 |
Fig. 5.25. Calorimeter sensitivity diagram
For calibration, the calorimeter is switched on and the potential difference at the bridge ends (ВР0) is measured without a sample or any other heat source. Then a plutonium standard is placed in the sample
266
chamber, the equilibrium value for the potential difference ВРs is measured and the calorimeter sensitivity is calculated by the formula:
S = (BPS – BP 0)/WS , |
(5.23) |
where WS is the standard-emitted power (not known).
Normally, the quantity S depends slightly on the heat source power. For example, a 1.6% sensitivity decrease was recorded in measurements of samples with the power of 0.1 to 10 W.
As the diagram in Fig. 5.25 shows, sensitivity in the given case is not constant and depends on the sample-generated power.
By and large, the best of the calorimetric analyses have the following
errors: power measurement error <0.1%, effective specific energy release determination error <0.2%.
Typical calorimeter parameters: diameter – 120 mm, height – 275 mm, range – 0–6 W.
Referenced standards or electrical standards (probes) are used to calibrate calorimeters:
1)heat generation standards – 238Pu samples. These feature:
∙small dimensions (enable determination of errors depending on the heat distribution over the chamber);
∙qualification accuracy – 0.02%;
∙decay may be accurately taken into account;
2) electrical heat generation standards. These feature:
∙absence of radioactive radiation;
∙no need for decay to be taken into account;
∙electronics may not depend on the calorimetric system;
∙electronics requires calibration.
The following is taken into account in calorimeter design.
∙Sample size (specifies the sample chamber size). A close samplecalorimeter contact makes it possible to minimize the analysis time. The chamber diameter in existing calorimeters varies form 1 to 30 cm.
∙Sample heat power. High-power samples need low-sensitivity calorimeters with a low heat resistance, and small-power samples require high-sensitivity and highly heat-resistant calorimeters.
∙Graduation techniques. The calorimeter design depends on what heat source is used for graduation (a radioisotope or an electrical one).
∙Capacity. Selection of the calorimeter type depends on the analysis time required.
267
∙Accuracy. When the calorimeter type and its operating mode are selected, the analysis accuracy is planned given the time to be spent and other conditions.
∙Application environment. Selection of the calorimeter design depends on the environment and the available workroom area to install it.
5.3. Destructive analyses
Normally, a destructive analysis (DA) includes sample taking, sample chemical treatment and measurement stages. Test material may be a single item or a bulk material. Destructive analysis normally offers a higher accuracy of results than nondestructive measurements. However, DA takes more time to perform and is more costly than nondestructive tests.
Destructive analyses are used to:
∙check nondestructive measurement data;
∙perform critical test measurements;
∙qualify standards.
Sample taking
Destructive analyses have a small portion of controlled material examined and require a representative sample to be taken for analysis. The sample composition should be strictly representative of the average material composition with the sample mass (volume) accurately determined.
If the sample is soluble, it needs to be, generally, dissolved. Sometimes, uranium or plutonium requires separation from interfering elements.
Sample should be taken given a potential heterogeneity of NM, which can be of three types:
∙heterogeneity of material within the container;
∙differences among containers;
∙differences among groups of containers.
Some dispersed and powdered materials, such as ash and roasted scrap, are hard to mix. A number of factors exist that require homogenization of dry powders and dispersed compositions. These are, for example:
∙variations of the composition depending on the particle size and density;
∙differences in the particle forms;
∙cohesion and conglomeration of particles.
268