Материал: Крючков Фундаменталс оф Нуцлеар Материалс Пхысицал Протецтион 2011
R=240 Pueff (473fis/s ×g)ε 2 exp(-P /τ ) ´
´[1- exp(-G /τ )]∑P(ν ) |
ν (ν -1) |
(5.22) |
|
, |
|||
2 |
|||
ν |
|
where Р is the pulse count predelay time, G is the coincidence count time; τ is the neutron lifetime in the detector, ε is the neutron detection efficiency,
νis the number of neutron emitted by fission, and P(ν) is the probability of
νneutrons to be emitted by fission.
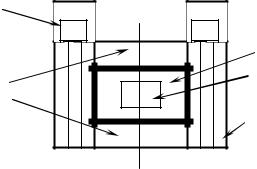
A schematic of a passive neutron coincidence counter for measurements of small-size samples is shown in Fig. 5.20.
Preamplifier
П
Lids
3Не-counter
П
Cavity Sample
 Cadmium
Polyethylene
Fig. 5.20. Schematic of a passive neutron coincidence counter for measurements of small-size samples
The neutrons emitted by the sample are slowed down in the polyethylene and detected by 3Не-counters. The cavity for the samples is cadmium-shielded against slow neutrons, coming back from the polyethylene, to reduce the sample self-screening.
The counter operates in two modes: for thermal and fast neutrons. For fast neutron count, the sample cavity walls are coated with cadmium. Measurements in the fast-neutron mode fit better large-mass samples and thermal-neutron measurements are fit for small-mass samples. Thermalneutron measurements entail a smaller statistical error of small-size sample control. For large-size samples, a great cross-section value leads to the inner space being screened and the result distorted.
261
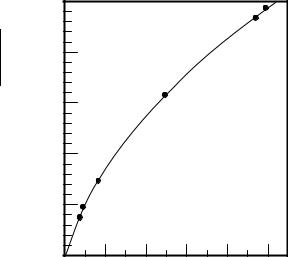
The counter is calibrated to interpret the analysis results. Calibration curves for the fastand thermal-neutron modes differ greatly. The calibration curve for the fast-neutron mode comprises two different segments: a segment with the influence of self-screening present (samples of the mass up to 500 g of 235U), and a further segment with multiplication where the 235U mass is rather large to compensate for the self-screening effect thanks to auxiliary fissions. Calibrating the interval of 150–900 g of 235U requires more than one standard. Each material type needs a special curve (Fig. 5.21).
.
time unit
events Coincidence count rate
500
400
300
200
100
0
0 |
20 |
40 |
60 |
80 |
100 |
Weight of 235U, g
Fig. 5.21. Coincidence count rate depending on the 235U mass for low-enriched U3O8 samples in the thermal neutron detection mode
Table 5.12 gives characteristics of an active well coincidence counter (AWCC).
There is a great variety of instruments based on neutron coincidence count, still all of them have standard electronic components.
Both neutron and gamma ray measurements involve a problem of measuring lengthy NM samples. Passive measurements of lengthy samples require ensuring similar probability conditions for detection of neutrons
262

emitted by all sample surface elements, while active measurements additionally require the same irradiation of all these elements by source neutrons. So every effort is made in designing neutron measuring systems to ensure a uniform sensitivity and a uniform field of external source neutrons in the cavity for the samples.
|
|
|
|
Table 5.12 |
|
Data of active well coincidence counter (AWCC) |
|||||
|
|
|
|
|
|
Characteristics |
Thermal mode |
|
Fast mode |
|
|
Mass of measured samples |
up to 100 g of 235U |
100–20000 g of 235U |
|
||
Coincidence count rate for low- |
11 count/(s×g of |
235 |
U) |
0.18 count/(s×g of |
|
enriched U3O8 sample |
|
235U) |
|
||
Absolute measurement error for |
0.3 g 235U |
|
|
18 g 235U |
|
large-size samples for 1000 s |
|
|
|
|
|
Calorimetry
Calorimetry is a passive nondestructive technique of NM (plutonium and tritium) control based on accurate temperature measurements. Generally, this is a more accurate technique, still it requires good temperature stability and control thereof, and is less fast and handy as compared to other NM nondestructive measurement methods.
Calorimeter is an instrument to measure the heat quantity emitted by an object.
Calorimetry offers an advantage that measurement results do not depend on the sample geometry, the matrix material or the NM distribution inside the sample. No standards identical to samples are required for calibrations. Calorimetric analyses have the accuracy comparable to that of chemical analyses .
Method description
All energy of α-decays transforms into heat. Each α-decay is accompanied by the energy yield of Q = (M 240 Pu − M 236 Pu − Mα )c2 =
Measurements of homogeneous burnt-up Pu samples give the accuracy of 0.1% as in chemical analyses and weighing. Measurements of waste containing Pu of a uniform isotopic composition gives a 1% accuracy.
263
5.25578 MeV. b-decay of 241Pu yields Qβ = 20.81 keV, and b-decay yields 3H Qβ = 18.59 keV.
Radioactive decays of 240Pu liberate P = l×N×Q of power, where N is
the number of 240Pu atoms, and l is the 240Pu decay constant. a-decay of 240Pu liberates 0.00707±0.00002 W/g of power. The total power generated by
all plutonium isotopes is Рeff(W/g)=ΣfiPi, where fi is the mass fraction of a single isotope.
Table 5.13 gives an example of the contribution made by some isotopes to Рeff. Рeff increases with the Pu burn-up increase. Burn-up fraction is characterized by the content of 240Pu.
|
|
Table 5.13 |
|
Contribution of selected isotopes to Рeff for one of the samples |
|||
|
|
|
|
|
Content, mass fraction |
Contribution to heat |
|
Isotope |
|
generation, % |
|
|
|
|
|
238Pu |
0.0006 |
11.0 |
|
239Pu |
0.8567 |
53.3 |
|
240Pu |
0.1211 |
27.7 |
|
241Pu |
0.0194 |
2.1 |
|
242Pu |
0.0022 |
0.0 |
|
241Am |
0.0016 |
5.9 |
|
By measuring the heat generated by a plutonium sample and knowing its isotopic composition, one can find the content of Pu.
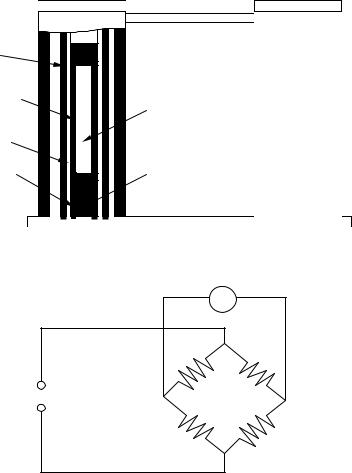
The sample-generated heat is recorded by a heat sensor out of a sensitive wire laid in circles around the sample cavity. A double calorimetric bridge with two identical thermostats is shown in Fig. 5.22.
Measurements are done using a potentiometer or a digital voltmeter incorporated in an electric circuit called Wheatstone bridge (Fig. 5.23). The measured voltage is proportional to the difference between the temperature in the sample space and the temperature of the comparison probe, the latter
being in an air or water “bath” with a constant tem perature (maintained within ±0.001 °C).
264
|
Sample thermostat |
Comparison sensor |
|
thermostat |
|
|
|
|
Resistance bridge |
|
|
nickel |
|
|
winding |
|
|
Heat chamber |
|
|
wall |
|
Sample |
Air |
|
cavity |
|
|
|
gap |
|
|
Plastic |
|
Heat-insulating |
end |
|
material |
Fig. 5.22. Schematic of a double calorimetric bridge with two identical thermostats
V
Reference arm
Current
source
Reference arm
Reference arm |
Test arm
Fig. 5.23. Wheatstone bridge for heat flux measurements
If the temperature in both thermostats is identical, that is there is no sample, the Wheatstone bridge is balanced. When the sample is placed in the thermostat, the temperature changes and the bridge turns unbalanced.
The voltmeter indication is taken some time after the sample is placed in the thermostat. The time needed to have equilibrium reached depends on the sample dimensions and amounts to hours (Fig. 5.24). Preheating of the
265