Материал: part17

DICOM PS3.17 2020a - Explanatory Information |
Page 231 |
U.1.7 Routine Stereo Camera Examination
A stereo optic disk examination is ordered for a patient with glaucoma. For this examination, the IOP does not need to be measured. The procedure includes:
1.Mydriasis using agent at time t
2.N stereo pictures (camera pictures right and left stereo picture simultaneously) of the optic disk region at the time t+s
The result is a study with:
a.N right and N left stereo pictures. These include acquisition information, lighting context, agent and time stamps.
i. One Stereometric Relationship SOP Instance, indicating that the above OP images should be used as stereo pairs.
U.1.8 Relative Image Position Definitions
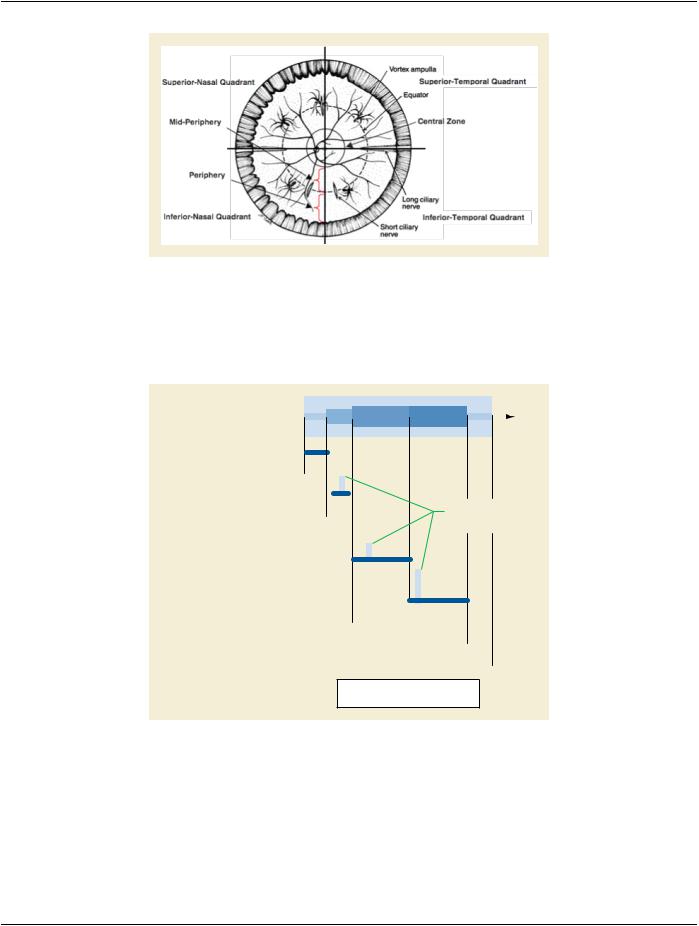
Ophthalmic mapping usually occurs in the posterior region of the fundus, typically in the macula or the optic disc. However, this or other imaging may occur anywhere in the fundus. The mapping data has clinical relevance only in the context of its location in the fundus, so this must be appropriately defined. CID 4207 “Ophthalmic Image Position” codes and the ocular fundus locations they represent are defined by anatomical landmarks and are described using conventional anatomic references, e.g., superior, inferior, temporal, and nasal. Figure U.1.8-1 is a schematic representation of the fundus of the left eye, and provides additional clarification of the anatomic references used in the image location definitions. A schematic of the right eye is omitted since it is identical to the left eye, except horizontally reversed (Temporal→Nasal, Nasal→Temporal).
The spatial precision of the following location definitions vary depending upon their specific reference. Any location that is described as "centered" is assumed to be positioned in the center of the referenced anatomy. However, the center of the macula can be defined visually with more precision than that of the disc or a lesion. The locations without a "center" reference are approximations of the general quadrant in which the image resides.
Note
An image < 15° angular subtend in the same position should be considered Lesion Centered.
Following are general definitions used to understand the terminology used in the code definitions.
•Central zone - a circular region centered vertically on the macula and extending one disc diameter nasal to the nasal margin of the disc and four disc diameters temporal to the temporal margin of the disc.
•Equator - the border between the mid-periphery and periphery of the retinal and corresponding to a circle approximately coincident with the ampulae of the vortex veins
•Superior - any region that is located superiorly to a horizontal line bisecting the macula
•Inferior - any region that is located inferiorly to a horizontal line bisecting the macula
•Temporal - any region that is located temporally to a vertical line bisecting the macula
•Nasal - any region that is located nasally to a vertical line bisecting the macula
•Mid-periphery - A circular zone of the retina extending from the central zone to the equator
•Periphery - A zone of the retinal extending from the equator to the ora serrata.
•Ora Serrata - the most anterior extent and termination of the retina
•Lesion - any pathologic object of regard
Figure U.1.8-1 illustrates anatomical representation of defined regions of the fundus of the left eye according to anatomical markers. Therighteyehasthesamerepresentationsbutreversedhorizontallysothattemporalandnasalarereversedwiththemacularemaining temporal to the disc.
Modified after Welch Allyn: http://www.welchallyn.com/wafor/students/Optometry-Students/BIO-Tutorial/BIO-Observation.htm.
- Standard -
Page 232 |
DICOM PS3.17 2020a - Explanatory Information |
Figure U.1.8-1. Anatomical Landmarks and References of the Left Ocular Fundus
U.2 Typical Sequence of Events
The following shows the proposed sequence of events using individual images that are captured for later stereo viewing, with the stereo viewing relationships captured in the stereometric relationship instance.
|
|
|
|
|
|
|
|
|
|
|
|
|
|
|
|
time |
|
|
|
|
|
|
|
|
|
|
|
|
|
|
|
|
|
|
|
|
|
|
|
|
|
|
|
|
|
|
|
|
|
|
|
|
|
|
|
|
|
|
|
|
|
|
|
|
|
|
|
|
|
|
|
|
|
|
|
|
|
|
|
|
|
|
|
|
Establish Baseline |
|
B L R |
|
|
|
|
|
|||||||||
|
|
|
|
|
|
|
|
|
|
|
|
|
|
|
|
|
|
|
|
|
|
|
|
|
|
|
|
|
|
|
|
|
|
Acquisition Information A |
|
|
|
|
|
|
|
|
|
|
|
|
|
|
|
|
|
|
L |
|
|
|
|
|
|
|
|
|
|
|
|
|
|
|
|
|
R |
|
|
|
|
|
|
|
|
|
|
|
|
|
|
|
|
L |
R |
|
|
|
|
|
|
|
|||||
Change Illumination and Filter |
|
|
|
|
|
|
|
|
|
|
|
|
|
|
|
|
|
|
|
|
|
|
|
|
|
|
|
|
Pairs of images intended |
||||
Acquisition Information B |
|
|
|
|
|
|
|
|
|
|
|
|
||||
|
|
|
|
|
|
|
|
|
|
|
|
for stereo viewing |
||||
Drug Injection |
|
|
|
|
|
|
|
|
|
|
|
|
|
|
|
|
|
|
|
|
|
|
L L |
|
L ... |
|
|
|
|
|
|||
|
|
|
|
|
|
L |
|
|
|
|
|
|||||
Short Term Angio Capture - SINGLE EYE |
|
|
|
|
|
L L |
L |
L ... |
|
|
|
|
|
|||
|
|
|
|
|
|
|
|
|
|
|
|
|
|
|
||
|
|
|
|
|
|
|
|
L |
|
L |
L ... |
|||||
|
|
|
|
|
|
|
|
|
|
|||||||
|
|
|
|
|
|
|
|
|
L |
|||||||
|
|
|
|
|
|
|
|
|
L |
L |
L |
L ... |
||||
|
|
|
|
|
|
|
|
|
R |
R |
R R ... |
|||||
Long Term Angio Capture - BOTH EYES |
|
|
|
|
|
|
|
|
R |
R |
R R ... |
|||||
|
|
|
|
|
|
|
|
|
|
|
|
|
|
|
||
Acquisition Information C and drug |
|
|
|
|
|
|
|
|
|
|
|
|
|
|
|
|
information |
|
|
|
|
|
|
|
|||||||||
Confirm Stereo Capture |
|
|
|
|
|
|
|
|
|
|
|
|
|
|
|
|
|
|
|
|
|
|
|
|
|
|
|
|
|
|
|
||
Stereometric Relationship SOP Instance |
|
|
|
|
|
|
|
|
|
|
|
|
|
|
||
B:OP SOP Instances stored for BOTH eyes
L:OP SOP Instances stored for LEFT eye
R:OP SOP Instances stored for RIGHT eye
Figure U.2-1. Typical Sequence of Events
The instances captured are all time stamped so that the fluorescein progress can be measured accurately. The acquisition and equipment information captures the different setups that are in use:
a.Acquisition information A is the ordinary illumination and planned lenses for the examination.
b.Acquisition information B is the filtered illumination, filtered viewing, and lenses appropriate for the fluorescein examination.
c.Acquisition information C indicates no change to the equipment settings, but once the injection is made, the subsequent images include the drug, method, dose, and time of delivery.
- Standard -
DICOM PS3.17 2020a - Explanatory Information |
Page 233 |
U.3 Ophthalmic Tomography Use Cases (Informative)
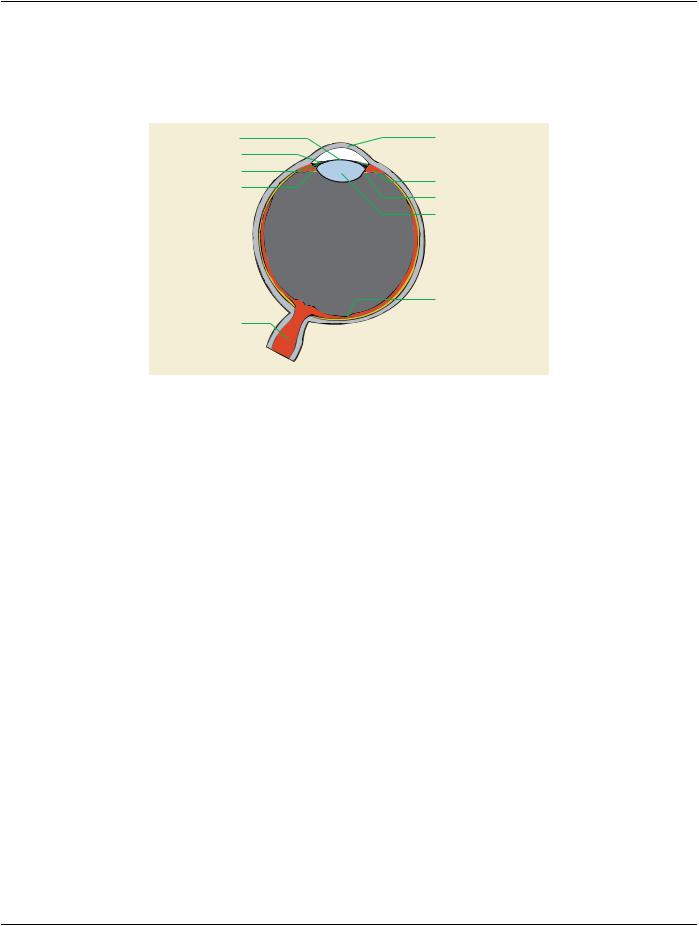
Optical tomography uses the back scattering of light to provide cross-sectional images of ocular structures. Visible (or near-visible) lightworkswellforimagingtheeyebecausemanyimportantstructuresareopticallytransparent(cornea,aqueoushumor,lens,vitreous humor, and retina - see Figure U.3-1).
Pupil |
|
|
Cornea |
|||||
Iris |
|
|
Anterior chamber |
|||||
|
|
|||||||
Posterior chamber |
|
|
filled with aqueous humor |
|||||
|
|
|
||||||
Zonular fibers |
|
|
Ciliary muscle |
|||||
|
|
|
||||||
Retina |
|
|
|
|
|
|
|
Suspensory ligament |
|
|
|
|
|
|
|
Lens |
|
|
|
|
|
|
||||
Choroid |
|
|
|
|
|
|
|
|
|
|
|
|
|
|
Vitreous humor |
||
|
|
|
|
|||||
Sclera |
|
|
|
|
|
|
|
|
|
|
|
|
|
|
|
||
|
|
|
|
|
Fovea |
|||
|
|
|
||||||
Optic disc |
|
|
|
|
|
|
|
|
|
|
|
|
|
||||
|
|
|
|
|||||
Optic nerve |
|
|
|
|||||
Figure U.3-1. Schematic representation of the human eye
To provide analogy to ultrasound imaging, the terms A-scan and B-scan are used to describe optical tomography images. In this setting,anA-scanistheimageacquiredbypassingasinglebeamoflightthroughthestructureofinterest.AnA-scanimagerepresents the optical reflectivity of the imaged tissue along the path of that beam - a one-dimensional view through the structure. A B-scan is then created from a collection of adjacent A-scan images - a two dimensional image. It is also possible to combine multiple B-scans into a 3-dimensional image of the tissue.
When using optical tomography in the eye it is desirable to have information about the anatomic and physiologic state of the eye. Measurementslikethepatient'srefractiveerrorandaxialeyelengtharefrequentlyimportantforcalculatingmagnificationorminification of images. The accommodative state and application of pupil dilating medications are important when imaging the anterior segment of the eye as they each cause shifts in the relative positions of ocular structures. The use of dilating medications is also relevant when imaging posterior segment structures because a small pupil can account for poor image quality.
U.3.1 Anterior Chamber Tomography
U.3.1.1 Anterior Chamber Exam For Phakic Intraocular Lens Surgery Planning
Ophthalmic tomography may be used to plan placement of a phakic intraocular lens (IOL). A phakic IOL is a synthetic lens placed in the anterior segment of the eye in someone who still has their natural crystalline lens (i.e., they are "phakic"). This procedure is done to correct the patient's refractive error, typically a high degree of myopia (near-sightedness). The exam will typically be performed on both eyes, and each eye may be examined in a relaxed and accommodated state. Refractive information for each eye is required to interpret the tomographic study.
A study consists of one or more B-scans (see Figure U.3-2) and one or more instances of refractive state information. There may be a reference image of the eye associated with each B-scan that shows the position of the scan on the eye.
U.3.1.2 Anterior Chamber Angle Exam
The anterior chamber angle is defined by the angle between the iris and cornea where they meet the sclera. This anatomic feature is important in people with narrow angles. Since the drainage of aqueous humor occurs in the angle, a significantly narrow angle can impede outflow and result in increased intraocular pressure. Chronically elevated intraocular pressures can result in glaucoma. Ophthalmic tomography represents one way of assessing the anterior chamber angle.
- Standard -

Page 234 |
DICOM PS3.17 2020a - Explanatory Information |
B-scans are obtained of the anterior segment including the cornea and iris. Scans may be taken at multiple angles in each eye (see Figure U.3-2). A reference image may be acquired at the time of each B-scan(s). Accommodative and refractive state information are also important for interpretation of the resulting tomographic information.
Figure U.3-2. Tomography of the anterior segment showing a cross section through the cornea
Note in the Figure the ability to characterize the narrow angle between the iris and peripheral cornea.
U.3.1.4 Corneal Exam
Asatransparentstructurelocatedatthefrontoftheeye,thecorneaisideallysuitedtoopticaltomography.Therearemultipledisease states including glaucoma and corneal edema where the thickness of the cornea is relevant and tomography can provide this inform- ation using one or more B-scans taken at different angles relative to an axis through the center of the cornea.
Tomography is also useful for defining the curvature of the cornea. Accurate measurements of the anterior and posterior curvatures are important in diseases like keratoconus (where the cornea "bulges" abnormally) and in the correction of refractive error via surgery or contact lenses. Measurements of corneal curvature can be derived from multiple B-scans taken at different angles through the center of the cornea.
In both cases, a photograph of the imaged structure may be associated with each B-scan image.
U.3.2 Posterior Segment Tomography
U.3.2.1 Retinal Nerve Fiber Layer Exam
The Retinal Nerve Fiber Layer (RNFL) is made up of the axons of the ganglion cells of the retina. These axons exit the eye as the optic nerve carrying visual signals to the brain. RNFL thinning is a sign of glaucoma and other optic nerve diseases.
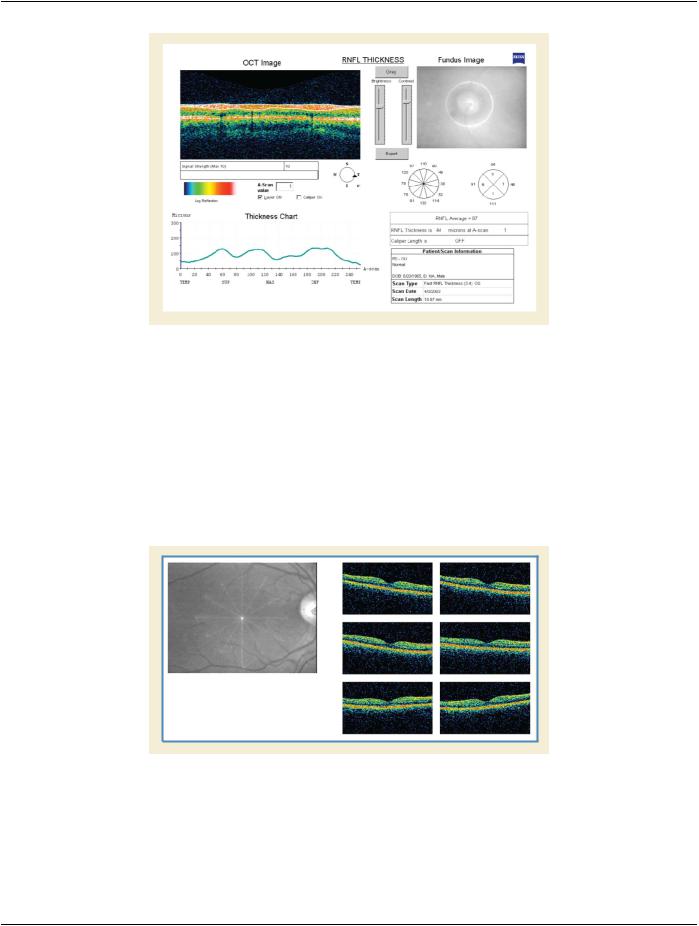
Anophthalmictomographystudycontainsoneormorecircularscans,perhapsatvaryingdistancesfromtheopticnerve.Eachcircular scan can be "unfolded" and treated as a B-scan used to assess the thickness of the nerve fiber layer (see Figure U.3-3). A fundus image that shows the scan location on the retina may be associated with each B-scan. To detect a loss of retinal nerve fiber cells the exam might be repeated one or multiple times over some period of time. The change in thickness of the nerve fiber tissue or a trend (serial plot of thickness data) might be used to support the diagnosis.
- Standard -
DICOM PS3.17 2020a - Explanatory Information |
Page 235 |
|
|
|
|
Figure U.3-3. Example tomogram of the retinal nerve fiber layer with a corresponding fundus image
In the Figure, the pseudo-colored image on the left shows the various layers of the retina in cross section with the nerve fiber layer between the two white lines. The location of the scan is indicated by the bright circle in the photograph on the right.
U.3.2.2 Macular Exam
The macula is located roughly in the center of the retina, temporal to the optic nerve. It is a small and highly sensitive part of the retina responsible for detailed central vision. Many common ophthalmic diseases affect the macula, frequently impacting the thickness of different layers in the macula. A series of scans through the macula can be used to assess those layers (see Figure U.3-4).
A study may contain a series of B-scans. A fundus image showing the scan location(s) on the retina may be associated with one or more B-scans. In the Figure, the corresponding fundus photograph is in the upper left.
Figure U.3-4. Example of a macular scan showing a series of B-scans collected at six different angles
U.3.2.3 Angiographic Exams
Some color retinal imaging studies are done to determine vascular caliber of retinal vessels, which can vary throughout the cardiac cycle.ImagesarecapturedwhileconnectedtoanECGmachineoracardiacpulsemonitorallowingimageacquisitiontobesynchronized to the cardiac cycle.
- Standard -