Материал: part17
Page 236 |
DICOM PS3.17 2020a - Explanatory Information |
Angiography is a procedure that requires a dye to be injected into the patient for the purpose of enhancing the imaging of vascular structures in the eye. A standard step in this procedure is imaging the eye at specified intervals to detect the pooling of small amounts of dye and/or blood in the retina. For a doctor or technician to properly interpret angiography images it is important to know how much time had elapsed between the dye being injected in the patient (time 0) and the image frame being taken. It is known that such dyes can have an affect on OPT tomographic images as well (and it may be possible to use such dyes to enhance vascular structure in theOPTimages),thereforetimesynchronizationwillbeappliedtothecreationoftheOPTimagesaswellasanyassociatedOPimages
The angiographic acquisition is instantiated as a multi-frame OPT Image. The variable time increments between frames of the image are captured in the Frame Time Vector of the OPT Multi-frame Module. For multiple sets of images, e.g., sets of retinal scan images, the Slice Location Vector will be used in addition to the Frame Time Vector. For 5 sets of 6 scans there will be 30 frames in the Multi- frame Image. The first 6 values in the Frame Time Vector will give the time from injection to the first set of scans, the second 6 will contain the time interval for the second set of 6 scans, and so on, for a total of 5 time intervals.
Another example of an angiographic study with related sets of images is a sequence of SLO/OCT/"ICG filtered" image triples (or SLO/OCT image pairs) that are time-stamped relative to a user-defined event. This user-defined event usually corresponds to the inject time of ICG (indocyanine green) into the patients blood stream. The resultant images form an angiography study where the patient's blood flow can be observed with the "ICG filtered" images and can be correlated with the pathologies observed in the SLO and OCT images that are spatially related to the ICG image with a pixel-to-pixel correspondence on the X-Y plane.
U.3.2.4 3D Reconstruction Exam
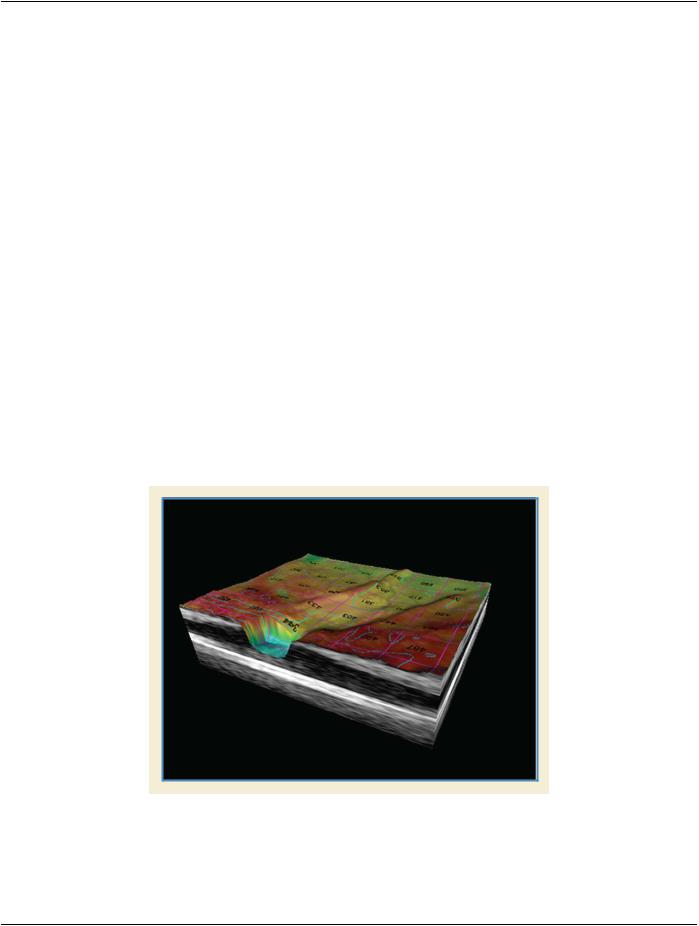
The prognosis of some pathologies can be aided by a 3D visualization of the affected areas of the eye. For example, in certain cases the density of cystic formations or the amount of drusen present can be hard to ascertain from a series of unrelated two-dimensional longitudinal images of the eye. However, some OCT machines are capable of taking a sequence of spatially related two-dimensional imagesinasuitablyshortperiodoftime.Theseimagescaneitherbeorientedlongitudinally(perpendiculartotheretina)ortransversely (near-parallel to the retina). Once such a sequence has been captured, it then becomes possible for the examined volume of data to be reconstructed for an interactive 3D inspection by a user of the system (see Figure U.3-5). It is also possible for measurements, including volumes, to be calculated based on the 3D data.
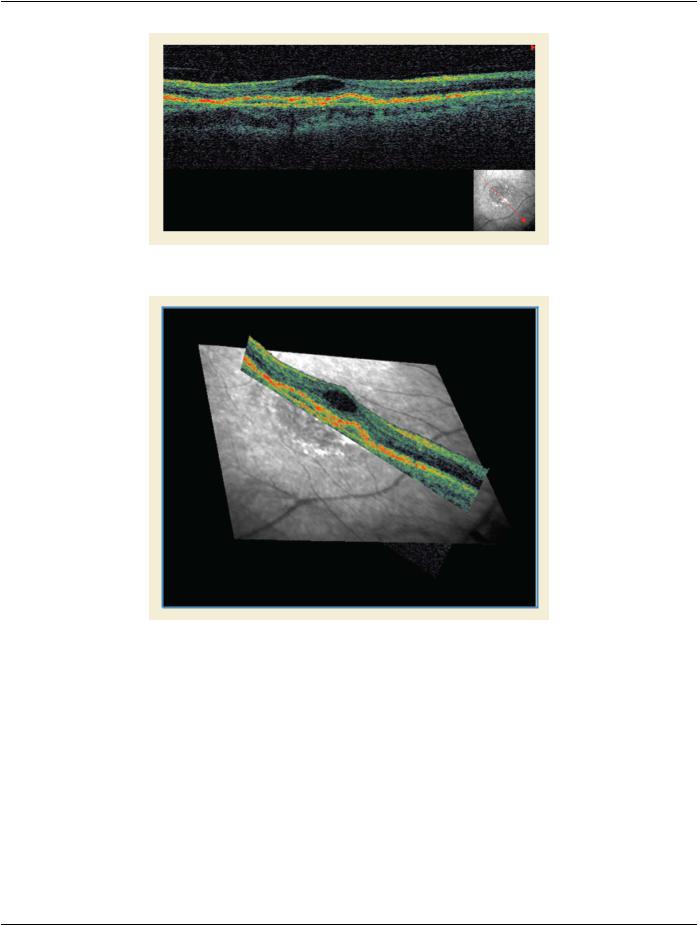
A reference image is often combined with the OCT data to provide a means of registering the 3D OCT data-set with a location on the surface of the retina (see Figure U.3-6 and Figure U.3-7).
Figure U.3-5. Example 3D reconstruction
- Standard -
DICOM PS3.17 2020a - Explanatory Information |
Page 237 |
|
|
|
|
Figure U.3-6. Longitudinal OCT Image with Reference Image (inset)
Figure U.3-7. Superimposition of Longitudinal Image on Reference Image
U.3.2.5 Transverse Imaging
While the majority of ophthalmic tomography imaging consists of sets of longitudinal images (also known as B scans or line scans), transverse images (also known as coronal or "en face" images) can also provide useful information in determining the full extent of the volume affected by pathology.
Longitudinalimagesareorientedinamannerthatisperpendiculartothestructurebeingexamined,whiletransverseimagesareoriented in an "en face" or near parallel fashion through the structure being examined.
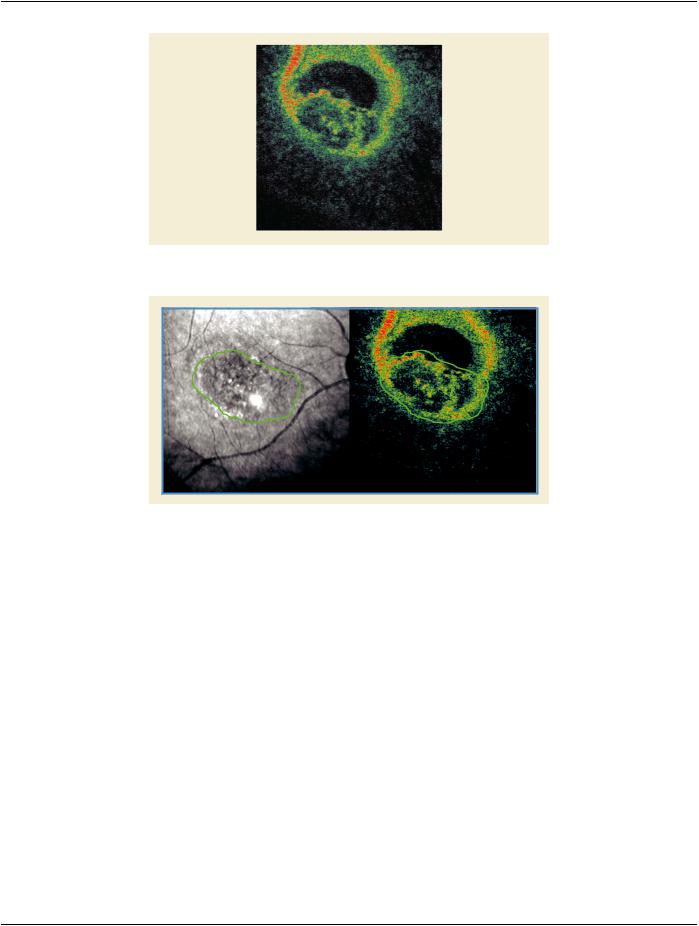
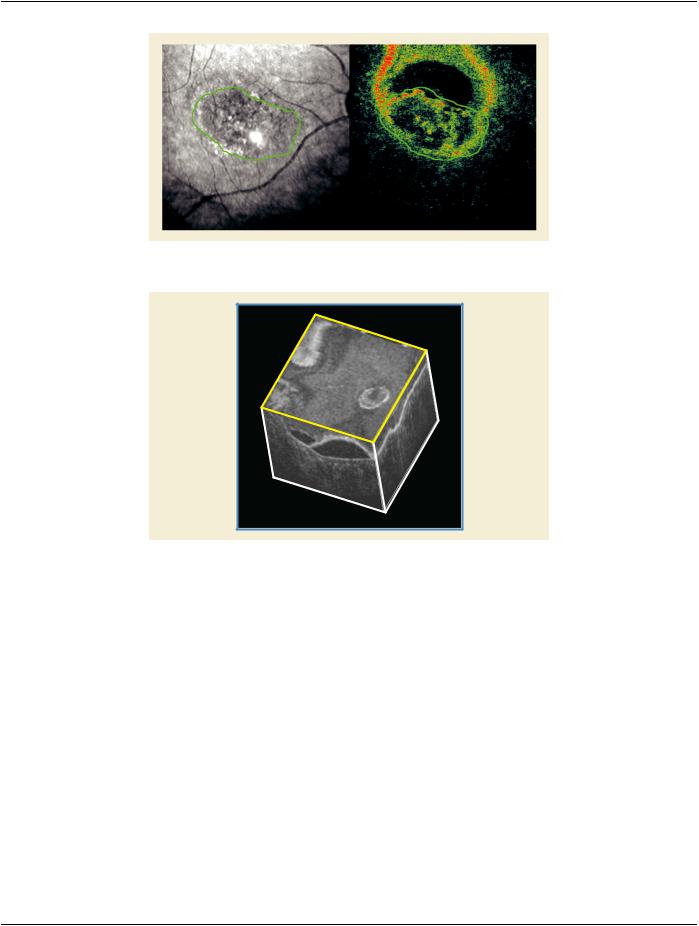
Transverse images can be obtained from a directly as a single scan (as shown in Figure U.3-8 and Figure U.3-9) or they can also be reconstructed from 3D data (as shown in Figure U.3-10 and Figure U.3-11). A sequence of transverse images can also be combined to form 3D data.
- Standard -
Page 238 |
DICOM PS3.17 2020a - Explanatory Information |
||
|
|
|
|
|
|
|
|
Figure U.3-8. Transverse OCT Image
Figure U.3-9. Correlation between a Transverse OCT Image and a Reference Image Obtained Simultaneously
FigureU.3-8,FigureU.3-9,FigureU.3-10andFigureU.3-11areallimagesofthesamepathologyinthesameeye,butthetwodifferent orientations provide complementary information about the size and shape of the pathology being examined. For example, when ex- aminingmacularholes,determiningtheamountofsurroundingcysticformationisimportantaidinthefollowingtreatment.Determining theextentofsuchcysticformationismuchmoreeasilyascertainedusingtransverseimagesratherthanlongitudinalimages.Transverse imagesarealsoveryusefulinlocatingmicro-pathologiessuchascoveredmacularholes,whichmaybeoverlookedusingconventional longitudinal imaging.
- Standard -
DICOM PS3.17 2020a - Explanatory Information |
Page 239 |
|
|
|
|
Figure U.3-10. Correspondence between Reconstructed Transverse and Longitudinal OCT Images
Figure U.3-11. Reconstructed Transverse and Side Longitudinal Images
In Figure U.3-10, the blue green and pink lines show the correspondence of the three images. In Figure U.3-11, the Transverse image is highlighted in yellow.
- Standard -

Page 240 |
DICOM PS3.17 2020a - Explanatory Information |
- Standard -