Материал: part17

Внимание! Если размещение файла нарушает Ваши авторские права, то обязательно сообщите нам

DICOM PS3.17 2020a - Explanatory Information​

Page 291​

Y VOI LUT Functions (Informative)​

Digital projection X-ray images typically have a very high dynamic range due to the digital detector's performance. In order to display​ these images, various Values Of Interest (VOI) transformations can be applied to the images to facilitate diagnostic interpretation.​ The original description of the DICOM grayscale pipeline assumed that either the parameters of a linear LUT (window center and​ width) are used, or a static non-linear LUT is applied (VOI LUT).​

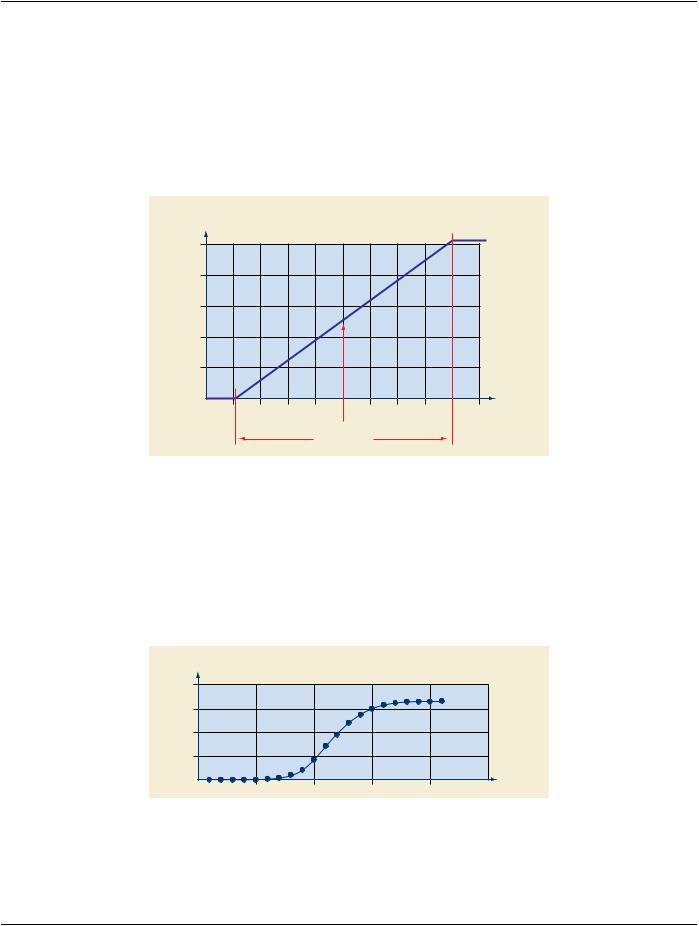
Normally,adisplayapplicationinterpretsthewindowcenterandwidthasparametersofafunctionfollowingalinearlaw(seeFigureY-​ 1).​

Output


Linear LUT


levels


250


200


150


100


50


0


Input


levels


0

50

100

150

200

250

Window center

Window width

Figure Y-1. Linear Window Center and Width​

A VOI LUT sequence can be provided to describe a non-linear LUT as a table of values, with the limitation that the parameters of this​ LUT cannot be adjusted subsequently, unless the application provides the ability to scale the output of the LUT (and there is no way​ in DICOM to save such a change unless a new scaled LUT is built), or to fit a curve to the LUT data, which may then be difficult to​ parametrize or adjust, or be a poor fit.​

Digital X-ray applications all have their counterpart in conventional film/screen X-ray and a critical requirement for such applications​ is to have an image "look" close to the film/screen applications. In the film/screen world the image dynamics are mainly driven by the​ H-D curve of the film that is the plot of the resulting optical density (OD) of the film with respect to the logarithm of the exposure. The​ typical appearance of an H-D curve is illustrated in Figure Y-2.​

Optical Density

H-D Curve

(OD)


4


3


2


1


0

Exposure

(log)


Figure Y-2. H-D Curve​

In digital applications, a straightforward way to mock up a film-like look would be to use a VOI LUT that has a similar shape to an H-​ D curve, namely a toe, a linear part and a shoulder instead of a linear ramp.​

- Standard -​

Page 292​

DICOM PS3.17 2020a - Explanatory Information​

While such a curve could be encoded as data within a VOI LUT, DICOM defines an alternative for interpreting the existing window​ center and width parameters, as the parameters of a non-linear function.​

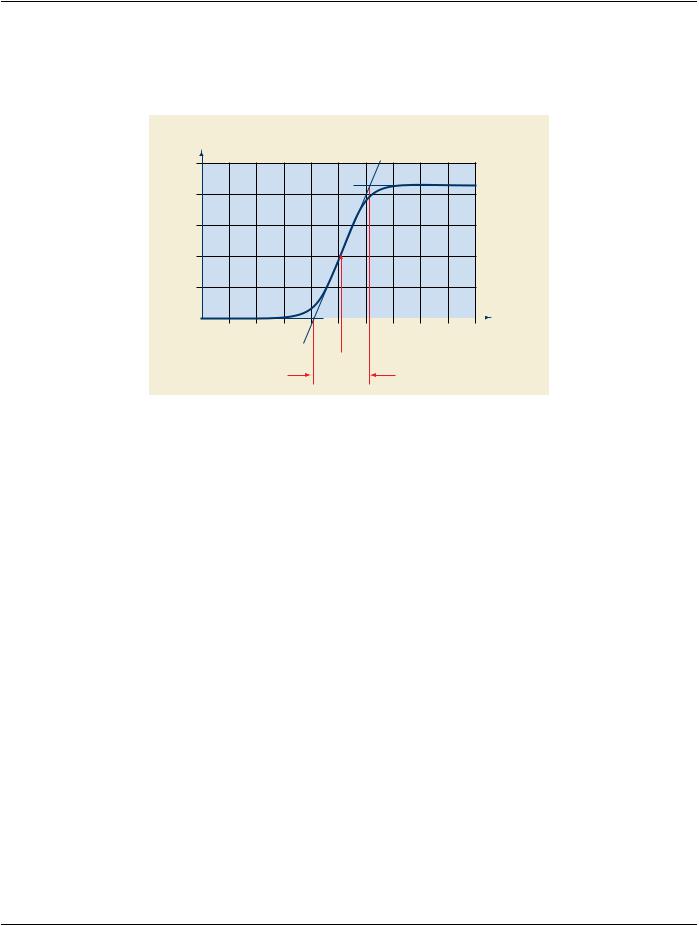
Figure Y-3 illustrates the shape of a typical sigmoid as well as the graphical interpretation of the two LUT parameters window center​ and window width. This figure corresponds to the equation definition in PS3.3 for the VOI LUT Function (0028,1056) is SIGMOID.​

Output

Sigmoid LUT

gray levels


250

200

150

100

50

0


Input


gray levels

0

50

100

150

200

250


Window center

Window width

Figure Y-3. Sigmoid LUT​

If a receiving display application does not support the SIGMOID VOI LUT Function, then it can successfully apply the same window​ center and window width parameters to a linear ramp and achieve acceptable results, specifically a similar perceived contrast but​ without the roll-off at the shoulder and toe.​

Areceivingdisplayapplicationthatdoessupportsuchafunctionisthenabletoallowtheusertoadjustthewindowcenterandwindow​ width with a more acceptable resulting appearance.​

- Standard -​

DICOM PS3.17 2020a - Explanatory Information​

Page 293​

ZX-RayIsocenterReferenceTransformations​ (Informative)​

Z.1 Introduction​

The Isocenter Reference System Attributes describe the 3D geometry of the X-Ray equipment composed by the X-Ray positioner​ and the X-Ray table.​

These Attributes define three coordinate systems in the 3D space:​

•​Isocenter coordinate system​

•​Positioner coordinate system​

•​Table coordinate system​

The Isocenter Reference System Attributes describe the relationship between the 3D coordinates of a point in the table coordinate​ system and the 3D coordinates of such point in the positioner coordinate system (both systems moving in the equipment), by using​ the Isocenter coordinate system that is fixed in the equipment.​

Z.2 Positioner Coordinate System Transformations​

Any point of the Positioner coordinate system (PXp, PYp, PZp) can be expressed in the Isocenter coordinate system (PX, PY, PZ) by​ applying the following transformation:​

(PX, PY, PZ)T = (R2 .R1)T .(R3 T .(PXp, PYp, PZp)T)​

(Z.2-1)​

And inversely, any point of the Isocenter coordinate system (P X , P Y , P Z ) can be expressed in the Positioner coordinate system​ (P Xp , P Yp , P Zp ) by applying the following transformation:​

(PXp, PYp, PZp)T= R3 .((R2 .R1).(PX, PY, PZ)T)​

(Z.2-2)​

Where R1, R2 and R3 are defined as follows:​


cos(Ap1)


sin(Ap1)

0


R1

= −sin(Ap1)

cos(Ap1)

0

(Z.2-3)​


0


0

1


0


0


1


R2

= 0

cos(Ap2)

−sin(Ap2)

(Z.2-4)​


0 sin(Ap2)

cos(Ap2)


)

0 −sin(Ap


)


cos(Ap

3

3


R3

=


0


1

0


(Z.2-5)​


sin(Ap3)

0

cos(Ap3)


Z.3 Table Coordinate System Transformations​

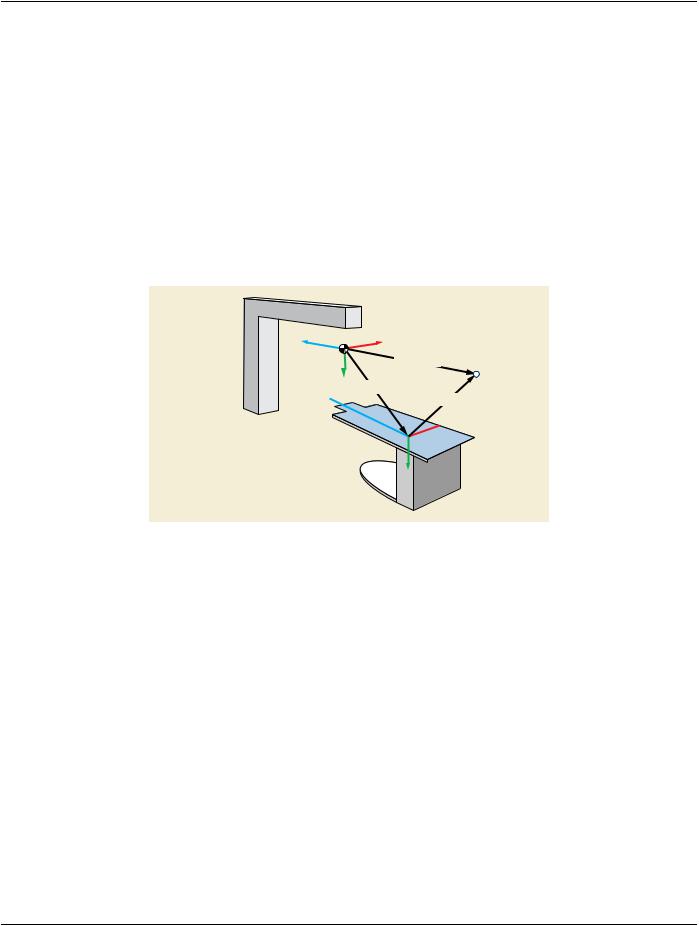
Any point of the table coordinate system (PXt, PYt, PZt) (see Figure Z-1) can be expressed in the Isocenter Reference coordinate​ system (PX, PY, PZ) by applying the following transformation:​

(PX, PY, PZ)T= (R3 .R2 .R1)T .(PXt, PYt, PZt)T+ (TX, TY, TZ)T​

(Z.3-1)​

And inversely, any point of the Isocenter coordinate system (PX, PY, PZ) can be expressed in the table coordinate system (PXt, PYt,​ PZt) by applying the following transformation:​

- Standard -​

Page 294​

DICOM PS3.17 2020a - Explanatory Information​

(PXt, PYt, PZt)T= (R3 .R2 .R1).((PX, PY, PZ)T- (TX, TY, TZ)T)​ Where R1, R2 and R3 are defined as follows:​


) 0 −sin(At

)


cos(At

1


R1

=


0


1

0

1


sin(At1) 0

cos(At1)


0


0


1


R2

= 0

cos(At2)

sin(At2)


0 −sin(At2) cos(At2)


0


cos(At3) −sin(At3)


R3

= sin(At3)

cos(At3)

0


0


0

1

+Z

+Y

Zt

O

+X


(Px, Py, Pz)

P


(Tx, Ty, Tz)


(Pxt, Pyt, Pzt)


Xt

Ot

Yt

(Z.3-2)​

(Z.3-3)​

(Z.3-4)​

(Z.3-5)​

Figure Z-1. Coordinates of a Point "P" in the Isocenter and Table coordinate systems​

- Standard -​

DICOM PS3.17 2020a - Explanatory Information​

Page 295​

AA Radiation Dose Reporting Use Cases​ (Informative)​

AA.1 Purpose of This Annex​

This Annex describes the use of the X-Ray Radiation Dose SR Object. Multiple systems contributing to patient care during a visit may​ expose the patient to irradiation during diagnostic and/ or interventional procedures. Each of those equipments may record the dose​ inanX-RayDoseReportinginformationobject.Radiationsafetyinformationreportingsystemsmaytakeadvantageofthisinformation​ and create dose reports for a visit, parts of a procedure performed or accumulation for the patient in total, if information is completely​ available in a structured content.​

AA.2 Definitions​

Irradiation Event​

An irradiation event is the loading of X-Ray equipment caused by a single continuous actuation of the equipment's irradiation switch,​ from the start of the loading time of the first pulse until the loading time trailing edge of the final pulse. The irradiation event is the​ "smallest" information entity to be recorded in the realm of Radiation Dose reporting. Individual Irradiation Events are described by a​ set of accompanying physical parameters that are sufficient to understand the "quality" of irradiation that is being applied. This set of​ parameters may be different for the various types of equipment that are able to create irradiation events. Any on-off switching of the​ irradiation source during the event is not treated as separate events, rather the event includes the time between start and stop of irra-​ diation as triggered by the user. E.g., a pulsed fluoro X-Ray acquisition is treated as a single irradiation event.​

Irradiation events include all exposures performed on X-Ray equipment, independent of whether a DICOM Image Object is being​ created. That is why an irradiation event needs to be described with sufficient Attributes to exchange the physical nature of irradiation​ applied.​

Accumulated Dose Values​

Accumulated Dose Values describe the integrated results of performing multiple irradiation events. The scope of accumulation is​ typically a study or a performed procedure step. Multiple Radiation Dose objects may be created for one Study or one Radiation Dose​ object may be created for multiple performed procedures.​

AA.3 Use Cases​

The following use cases illustrate the information flow between participating roles and the possible capabilities of the equipment that​ is performing in those roles. Each case will include a use case diagram and denote the integration requirements. The diagrams will​ denote actors (persons in role or other systems involved in the process of data handling and/or storage). Furthermore, in certain​ cases it is assumed that the equipment (e.g., Acquisition Modality) is capable of displaying the contents of any dose reports it creates.​

These use cases are only examples of possible uses for the Dose Report, and are by no means exhaustive.​

AA.3.1 Basic Dose Reporting​

This is the basic use case for electronic dose reporting. See Figure AA.3-1.​

- Standard -​

Источник: https://studfile.net/preview/14585770/