Материал: part17

Внимание! Если размещение файла нарушает Ваши авторские права, то обязательно сообщите нам

DICOM PS3.17 2020a - Explanatory Information​

Page 491​

X-Ray Incidence

X-ray Source

(Pxp, Pyp, Pzp)

+ Zp

+ Yp


+ Xp


(Pu, Pv)

ISO


v


Op


u


SID


o


Receptor Plane

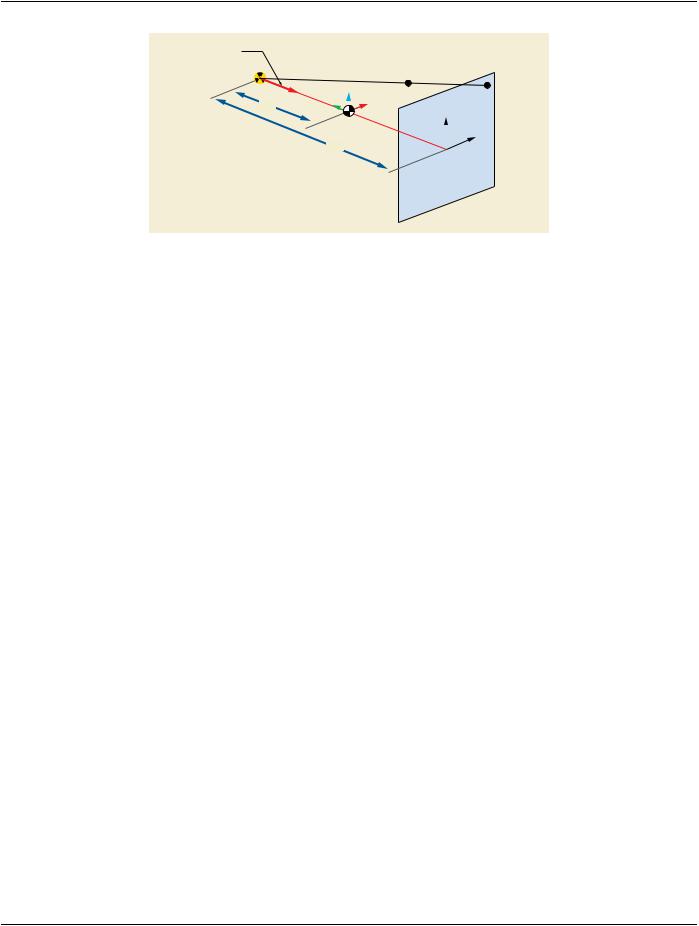
Figure FFF.1.2-8. Projection of a Point of the Positioner Coordinate System​

A point (P Xp , P Yp , P Zp ) in the positioner coordinate system (Op, Xp, Yp, Zp) can be expressed as a point (P u , Pv) in the image​ coordinate system by applying the following transformation:​

Pu = (SID / (ISO - PYp) ).PXp​

Pv = (SID / (ISO - PYp) ).PZp​

The ratio SID / (ISO - PYp) is also called magnification ratio of this particular point.​

FFF.1.2.5 Field of View Transformations​

FFF.1.2.5.1 Detector​

The following concepts illustrate the model of the X-Ray detector:​

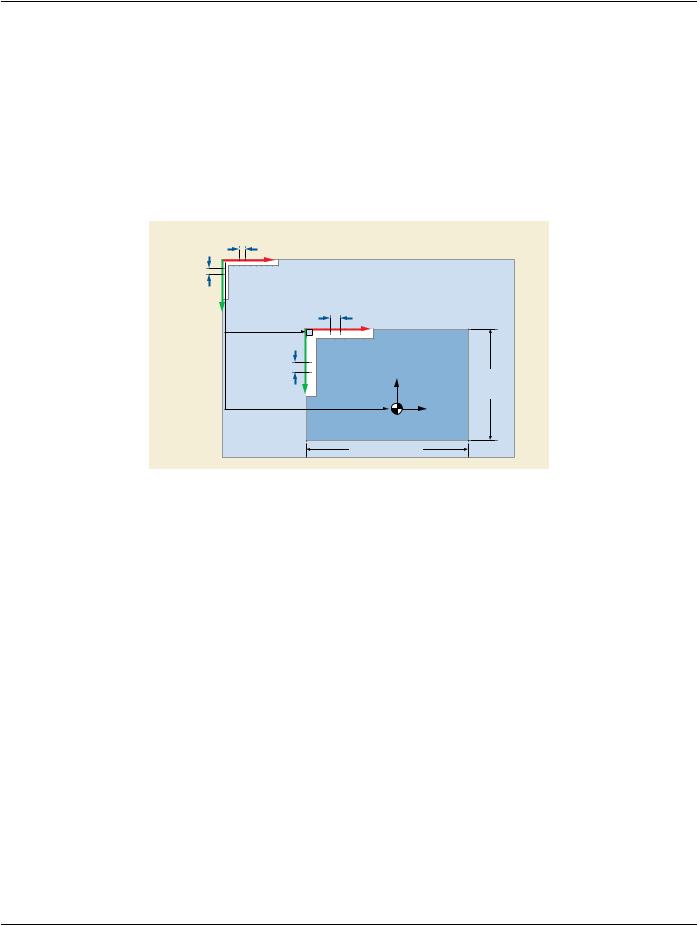
Physical detector array (or physical detector matrix) is the matrix composed of physical detector elements.​

Note​

NotallthedetectorelementsareactivatedduringanX-Rayexposure.Theactivedetectorelementsareinthedetectoractive​ area, which can be equal to or smaller than the physical detector area.​

Physical detector element coordinates represented as (idet, jdet) are columns and rows of the physical detector element in the​ physical detector array.​

Detector TLHC element is the detector element in the Top Left Hand Corner of the physical detector array and corresponds to (idet,​ jdet) = (0,0).​

The Attribute Detector Element Physical Size (0018,7020) represents the physical dimensions in mm of a detector element in the​ row and column directions.​

The Attribute Detector Element Spacing (0018,7022) contains the two values Djdet and Didet, which represent the physical distance​ in mm between the centers of each physical detector element:​

•​Didet = detector element spacing between two adjacent columns;​

•​Djdet = detector element spacing between two adjacent rows.​

The Attribute Detector Element Physical Size (0018,7020) may be different from the Detector Element Spacing (0018,7022) due to​ the presence of spacing material between detector elements.​

TheAttributePosition of Isocenter Projection (0018,9430)containsthepoint(ISO_Pidet, ISO_Pjdet),which represents theprojection​ of the Isocenter on the detector plane, measured as the offset from the center of the detector TLHC element. It is measured in phys-​

ical detector elements.​

- Standard -​

Page 492​

DICOM PS3.17 2020a - Explanatory Information​

The Attribute Imager Pixel Spacing (0018,1164) contains the two values Dj and Di, which represent the physical distance measured​ at the receptor plane between the centers of each pixel of the FOV image:​

•​Di =imager pixel spacing between two adjacent columns;​

•​Dj =imager pixel spacing between two adjacent rows.​

The zoom factor represents the ratio between Imager Pixel Spacing (0018,1164) and Detector Element Spacing (0018,7022). It may​ be different from the detector binning (e.g., when a digital zoom has been applied to the pixel data).​

•​Zoom factor (columns) = Di / Didet;​

•​Zoom factor (rows) = Dj / Djdet.​

∆idet

idet

Physical detector matrix

∆jdet


jdet

∆i


FOV origin

i

Field of View

(FOVidet, FOVjdet)


∆j

v

FOV


Column


Dimension

Isocenter projection


u

(ISO_Pidet, ISO_Pjdet)


ISO_P


FOV Row Dimension


Figure FFF.1.2-9. Physical Detector and Field of View Areas​

FFF.1.2.5.2 Field of View​

The following concepts illustrate the model of the field of view:​

The field of view (FOV) corresponds to a region of the physical detector array that has been irradiated.​

The field of view image is the matrix of pixels of a rectangle circumscribing the field of view. Each pixel of the field of view image​ may be generated by multiple physical detector elements.​

The Attribute FOV Origin (0018,7030) contains the two values (FOV idet, FOV jdet ), which represent the offset of the center of the​ detector element at the TLHC of the field of view image, before rotation or flipping, from the center of the detector TLHC element. It​

is measured in physical detector elements. FOV Origin = (0,0) means that the detector TLHC element is at the TLHC of a rectangle​ circumscribing the field of view.​

TheAttributeFOVDimension(0018,9461)containsthetwovaluesFOVrowdimensionandFOVcolumndimension,whichrepresent​ the dimension of the FOV in mm:​

•​FOV row dimension =dimension in mm of the field of view in the row direction;​

•​FOV column dimension = dimension in mm of the field of view in the column direction.​

FOV pixel coordinates represented as (i, j) are columns and rows of the pixels in the field of view image.​

FOV TLHC pixel is the pixel in the Top Left Hand Corner of the field of view image and corresponds to (i, j) = (0,0).​

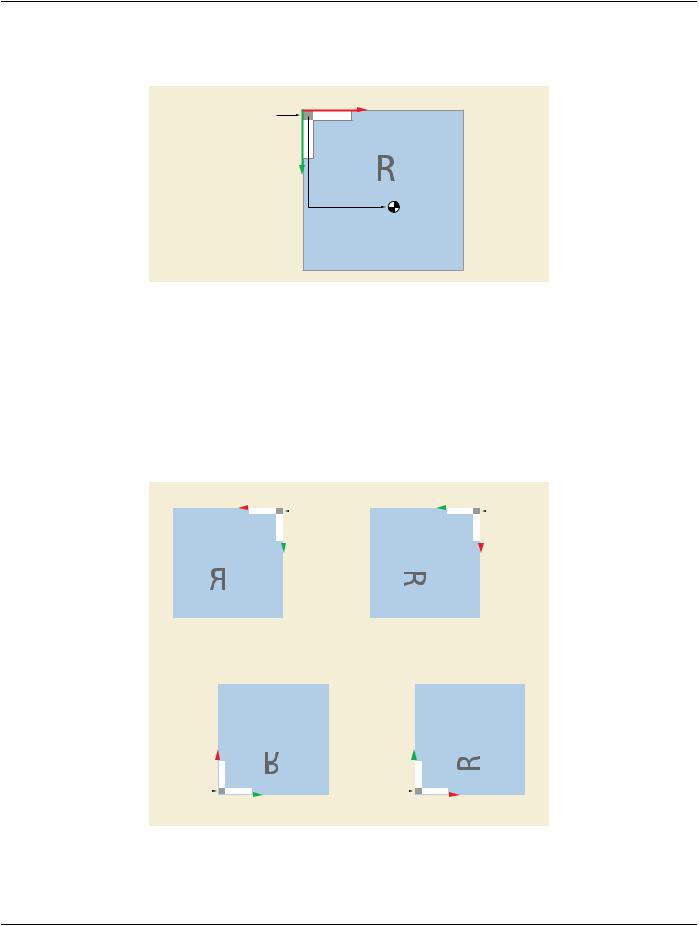
As an example, the point (ISO_Pi, ISO_Pj) representing the projection of the Isocenter on the field of view image, and measured in​ FOV pixels as the offset from the center of the FOV TLHC pixel, can be calculated as follows:​

- Standard -​

DICOM PS3.17 2020a - Explanatory Information​

Page 493​

ISO_Pi = (ISO_Pidet - FOVidet).Didet / Di - (1 - Didet / Di) / 2​

ISO_Pj = (ISO_Pjdet - FOVjdet).Djdet / Dj - (1 - Djdet / Dj) / 2​

i

Field of View

FOV TLHC


(ISO_Pi, ISO_Pj)


ISO_P

Figure FFF.1.2-10. Field of View Image​

FFF.1.2.5.3 Field of View Rotation and Flip​

The Attribute FOV Rotation (0018,7032) represents the clockwise rotation in degrees of field of view relative to the physical detector.​

The Attribute FOV Horizontal Flip (0018,7034) defines whether or not a horizontal flip has been applied to the field of view after ro-​ tation relative to the physical detector.​

The Attribute Pixel Data (7FE0,0010) contains the FOV image after rotation and/or flipping.​

Pixel data coordinates is the couple (c,r) where c is the column number and r is the row number.​


i


j


FOV TLHC


FOV TLHC


pixel data


j

pixel data


i


FOV Rotation (0081,7032) = 0

FOV Rotation (0081,7032) = 90

FOV Horizontal Flip (0018,7034) = YES

FOV Horizontal Flip (0018,7034) = NO


pixel data


pixel data


j


i


FOV TLHC


i


FOV TLHC


j


FOV Rotation (0081,7032) = 180


FOV Rotation (0081,7032) = 270


FOV Horizontal Flip (0018,7034) = YES


FOV Horizontal Flip (0018,7034) = NO

Figure FFF.1.2-11. Examples of Field of View Rotation and Horizontal Flip​

- Standard -​

Page 494​

DICOM PS3.17 2020a - Explanatory Information​

FFF.1.3 Calibration​

The X-Ray Projection Pixel Calibration Macro of the Section C.8.19.6.9 “X-Ray Projection Pixel Calibration Macro” in PS3.3 specifies​ the Attributes of the image pixel size calibration model in X-Ray conic projection, applicable to the Enhanced XA SOP Class.​

In this model, the table plane is specified relative to the Isocenter. As default value for the Attribute Distance Object to Table Top​ (0018,9403), the half distance of the patient thickness may be used.​

Oblique projections are considered in this model by the encoding of the Attribute Beam Angle (0018,9449), which can be calculated​ from Positioner Primary Angle (0018,1510) and Positioner Secondary Angle (0018,1511) as follows:​

For Patient Positions HFS, FFS, HFP, FFP:Beam Angle = arcos( |cos(Positioner Primary Angle) | * |cos(Positioner Secondary Angle)​ | ).​

For Patient Positions HFDR, FFDR, HFDL, FFDL:Beam Angle = arcos( |sin(Positioner Primary Angle) | * |cos(Positioner Secondary​ Angle) | ).​

The resulting pixel spacing, defined as D Px * SOD / SID, is encoded in the Attribute Object Pixel Spacing in Center of Beam​ (0018,9404). Its accuracy is practically limited to a beam angle range of +/- 60 degrees.​

FFF.1.4 X-Ray Generation​

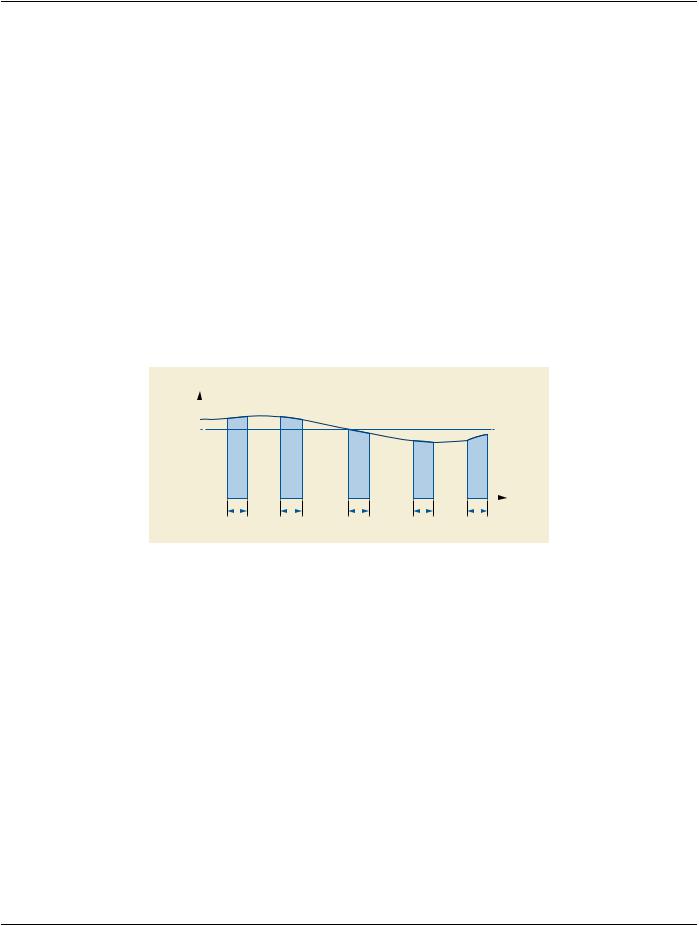
This chapter illustrates the relationships between the X-Ray generation parameters:​

X-Ray Current


mA1

mA2

mA


mA5


Average


3


mA4


mA


Frame

Frame

Frame

Frame

Frame


#1


#2


#3


#4


#5


Time


∆t1(ms)

∆t2(ms)

∆t3(ms)

∆t4(ms)

∆t5(ms)

Figure FFF.1.4-1. Example of X-Ray Current Per-Frame of the X-Ray Acquisition​

Values per frame are represented by the following symbols in this section:​

In the Frame Content Sequence (0020,9111):​

· Frame Acquisition Duration (0018,9220) in ms of frame « i » =Dti​

In the Frame Acquisition Sequence (0018,9417):​

·KVP (0018,0060) of frame « i » = kVpi​

·X-Ray Tube Current in mA (0018,9330) of frame « i » = mAi​

The following shows an example of calculation of the cumulative and average values per image relative to the values per-frame:​

•​Number of Frames (0028,0008) = N​

•​Exposure Time (0018,9328) in ms = SUMN (Dti)​

•​X-Ray Tube Current (0018,9330) in mA = 1/N * SUMN (mAi)​

•​Average Pulse Width (0018,1454) in ms = 1/N * SUMN (Dti)​

- Standard -​

DICOM PS3.17 2020a - Explanatory Information​

Page 495​

•​KVP (0018,0060) = 1/N * SUMN (kVpi)​

•​Exposure (0018,9332) in mAs = SUMN (Dti * mAi / 1000)​

FFF.1.5 Pixel Data Properties and Display Pipeline​

This chapter describes the concepts of the display pipeline.​

TheX-Rayintensity(I)attheimagereceptorisinverselyproportionaltotheexponentialfunctionoftheproductoftheobject'sthickness​

(x) traversed by the X-Ray beam and its effective absorption coefficient (m): I ~ e- m x.​

The X-Ray intensity that comes into contact with the image receptor is converted to the stored pixel data by applying specific signal​ processing. As a first step in this conversion, the amplitude of the digital signal out of the receptor is linearly proportional to the X-Ray​ intensity. In further steps, this digital signal is processed in order to optimize the rendering of the objects of interest present on the​ image.​

The Enhanced XA IOD includes Attributes that describe the characteristics of the stored pixel data, allowing to relate the stored pixel​ data to the original X-Ray intensity independently from the fact that the image is "original" or "derived".​

When the Attribute Pixel Intensity Relationship (0028,1040) equals LIN:​

•​P ~ I: The pixel values (P) are approximately proportional to X-Ray beam intensity (I).​

When the Attribute Pixel Intensity Relationship (0028,1040) equals LOG:​

•​P ~ x: The pixel values (P) are approximately proportional to the object thickness (x).​

In order to ensure consistency of the displayed stored pixel data, the standard display pipeline is defined.​

On the other side, the stored pixel data is also used by applications for further analysis like segmentation, structure detection and​ measurement, or for display optimization like mask subtraction. For this purpose, the Pixel Intensity Relationship LUT described in​ Section C.7.6.16.2.13.1 “Pixel Intensity Relationship LUT” in PS3.3 defines a transformation LUT enabling the conversion from the​ stored pixel data values to linear, logarithmic or other relationship.​

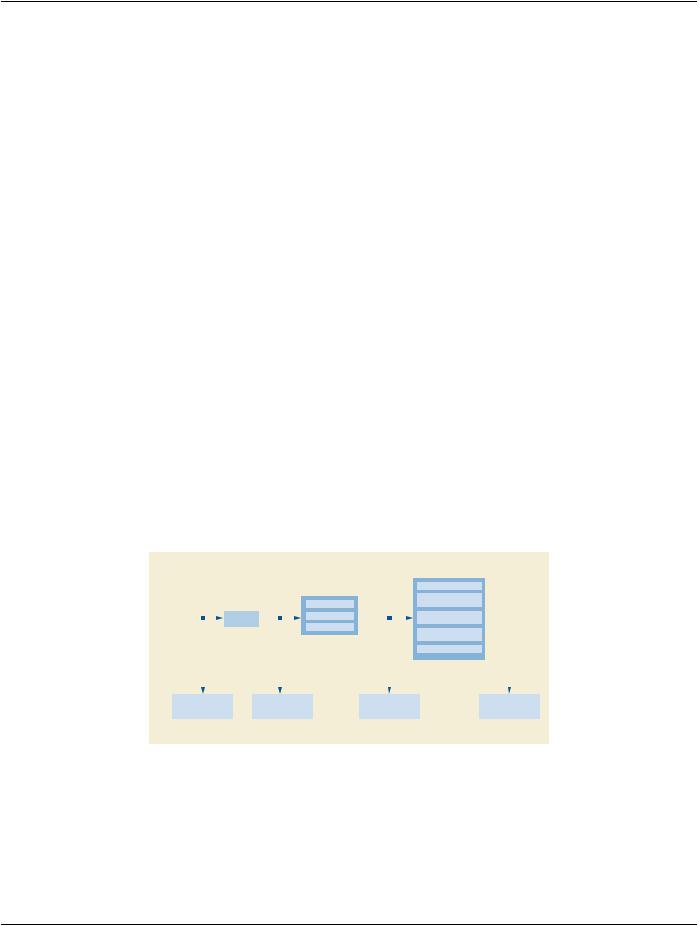
For instance, if the image processing applied to the X-Ray intensity before storing the Pixel Data allows returning to LIN, then a Pixel​ IntensityRelationshipLUTwiththefunction"TO_LINEAR"isprovided.Thefollowingfigureshowssomeexamplesofimageprocessing,​ and the corresponding description of the relationship between the stored pixel data and the X-Ray intensity.​


Geometric or Densitometric


Transformation


Rotation/Zoom/Shift/Flip


Densitometric Transformation


Aspect Ratio/


Densitometric


Re-scaling


geometrical distortion


Transformation


X-Ray


Encoding LUT


Multi-band re-scaling


Spatial Filter convolution:


Intensity


(log, sqrt, ...)


Edge Enhancement, etc


Mask Subtraction


.


Linear or NON-Linear LUTS


(volume, gamma, etc.


Time Filtering


Stored Pixel Data


Stored Pixel Data


Stored Pixel Data


Stored Pixel Data


Pixel Intensity Relationship


Pixel Intensity Relationship


Pixel Intensity Relationship


Pixel Intensity Relationship


(0028,1040)


(0028,1040)


(0028,1040)


(0028,1040)


= LIN


= LIN, LOG OR OTHER


= OTHER


= OTHER


Transformation TO_LINEAR


Transformation TO_LINEAR


Transformation TO_LINEAR


provided if LOG or OTHER


not provided


not provided

Figure FFF.1.5-1. Examples of Image Processing prior to the Pixel Data Storage​

No solution is proposed in the Enhanced XA SOP Class to standardize the subtractive display pipeline. As the Enhanced XA image​ is not required to be stored in a LOG relationship, the Pixel Intensity Relationship LUT may be provided to convert the images to the​ logarithmic space before subtraction. The creation of subtracted data to be displayed is a manufacturer-dependent function.​

As an example of subtractive display, the pixel values are first transformed to a LOG relationship, and then subtracted to bring the​ background level to zero and finally expanded to displayable levels by using a non-linear function EXP similar to an exponential.​

- Standard -​

Источник: https://studfile.net/preview/14585770/