Материал: Oxford American Handbook of Urology ( PDFDrive )
|
PROSTATE CANCER STAGING 207 |
Bladder |
T1 |
|
|
|
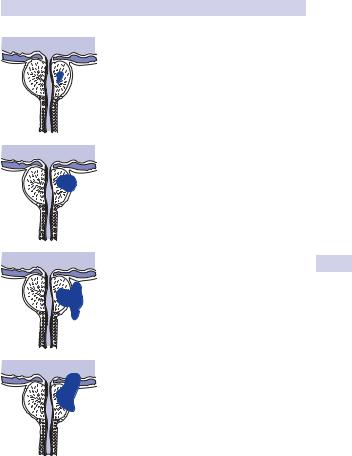
Early (non-palpable) prostate |
|
cancer only detectable under |
|
the microscope; found at |
|
TURP or by needle biopsy |
Urethra |
|
|
T2 |
|
Early (palpable) prostate |
|
cancer |
T3
Locally advanced prostate cancer—into peri-prostate fat or seminal vesicles
T4
Locally advanced prostate cancer—invades the bladder, rectum, penile urethra, or pelvic side wall
Figure 6.3 The T stages of prostate cancer. (2002 TNM System)
Nstage
Nstage is assessed by imaging (CT/MRI) or biopsy as necessary. Pelvic lymph node dissection is the gold-standard assessment of N stage. MRI or CT scanning may image enlarged nodes and most radiologists report nodes of >5 mm in maximal diameter.
However, nodes larger than this often contain no cancer, while micrometastases may be present in normal-sized nodes.

208 CHAPTER 6 Urological neoplasia
Mstage
Mstage is assessed by use of physical examination, imaging (MRI or isotope bone scan, chest radiology), and biochemical investigations (e.g., alkaline phosphatase).
Nomograms
Based on several thousand radical prostatectomies, these are used widely to predict pathological T and N stage by combining clinical T stage, PSA, and biopsy Gleason score. Nomograms, developed by Kattan and associates (www.nomograms.org), may be able to predict final pathological stage on the basis of preoperative parameters.
Higher pathological stage (i.e., pT3 disease) found at radical prostatectomy may also be predicted by the following:1
•Higher percentages (>66%) of positive biopsies
•Cancer invading adipose in the biopsies (there is no fat in the prostate)
•Possibly the presence of perineural cancer invasion within the prostate
Partin tables
These tables are useful to predict the stage of prostate cancer treated by radical prostatectomy (Table 6.3). Table 6.3 reflects an updated version of the 2001 Partin tables with a contemporary patient cohort (5730 men treated with prostatectomy and no additional therapy from 2000 to 2005 at the Johns Hopkins Hospital). This cohort demonstrated trends in presentation and pathological stage for men diagnosed with clinically localized prostate cancer and was used to correct for the effects of stage migration.
Table 6.3 Partin tables
PSA |
Pathological |
Biopsy Gleason Score |
||
range |
stage |
|
|
|
|
|
|
||
(ng/mL) |
5–6 |
3 + 4=7 |
4 + 3 = 7 8–10 |
|
Clinical stage T1c (nonpalpable, PSA elevated) (n = 4419)
0–2.5 |
Organ confined |
93 (91–95) |
82 (76–87) |
73 (64–80) |
77 (65–85) |
|
(n = 226) |
|
|
|
|
|
Extraprostatic |
6 (5–8) |
14 (10–18) |
20 (14–28) |
16 (11–24) |
|
extension |
|
|
|
|
|
(n = 19) |
|
|
|
|
|
Seminal vesicle |
0 (0–1) |
2 (0–5) |
2 (0–5) |
3 (0–8) |
|
(+) (n = 1) |
|
|
|
|
|
Lymph node (+) |
0 (0–1) |
2 (0–6) |
4 (1–12) |
3 (1–12) |
|
(n = 3) |
|
|
|
|
2.6–4.0 |
Organ confined |
88 (86–90) |
72 (67–76) |
61 (54–68) |
66 (57–74) |
|
(n = 619) |
|
|
|
|
|
Extraprostatic |
11 (10–13) |
23 (19–27) |
33 (27–39) |
26 (19–34) |
|
extension (n = 92) |
|
|
|
|

|
|
|
|
PROSTATE CANCER STAGING |
209 |
||||
|
Table 6.3 Continued |
|
|
|
|
|
|
|
|
|
|
|
|
|
|
|
|
|
|
|
PSA |
Pathological |
|
Biopsy Gleason Score |
|
|
|
|
|
|
range |
stage |
|
|
|
|
|
|
|
|
5–6 |
3 + 4=7 |
4 + 3 = 7 |
8–10 |
|
|
|||
|
(ng/mL) |
|
|
|
|||||
|
|
|
|
|
|
|
|
|
|
|
|
Seminal vesicle (+) 1 (0–1) |
4 (2–7) |
5 (2–8) |
7 (3–13) |
|
|
||
|
|
(n = 8) |
|
|
|
|
|
|
|
|
|
Lymph node (+) |
0 (0–0) |
1 (0–1) |
1 (0–3) |
1 (0–3) |
|
|
|
|
|
(n = 1) |
|
|
|
|
|
|
|
|
4.1–6.0 |
Organ confined |
83 (81–85) |
63 (59–67) |
51 (45–56) |
55 (46–64) |
|
|
|
|
|
(n = 1266) |
|
|
|
|
|
|
|
|
|
Extraprostatic |
16 (14–17) |
30 (26–33) |
40 (34–45) |
32 (25–40) |
|
|
|
|
|
extension |
|
|
|
|
|
|
|
|
|
(n = 297) |
|
|
|
|
|
|
|
|
|
Seminal vesicle (+) 1 (1–1) |
6 (4–8) |
7 (4–10) |
10 (6–15) |
|
|
||
|
|
(n = 37) |
|
|
|
|
|
|
|
|
|
Lymph node (+) |
0 (0–0) |
2 (1–3) |
3 (1–6) |
3 (1–6) |
|
|
|
|
|
(n = 12) |
|
|
|
|
|
|
|
|
6.1–10.0 |
Organ confined |
81 (79–83) |
59 (54–64) |
47 (41–53) |
51 (41–59) |
|
|
|
|
|
||||||||
|
|
(n = 989) |
18 (16–19) |
32 (27–36) |
42 (36–47) |
34 (26–42) |
|
|
|
|
|
|
|
||||||
|
|
Extraprostatic |
|
|
|||||
|
|
extension |
|
|
|
|
|
|
|
|
|
(n = 281) |
|
|
|
|
|
|
|
|
|
Seminal vesicle (+) 1 (1–2) |
8 (6–11) |
8 (5–12) |
12 (8–19) |
|
|
||
|
|
(n = 36) |
|
|
|
|
|
|
|
|
|
Lymph node (+) |
0 (0–0) |
1 (1–3) |
3 (1–5) |
3 (1–5) |
|
|
|
|
|
(n = 5) |
|
|
|
|
|
|
|
>10.0 |
Organ confined |
70 (66–74) |
42 (37–48) |
30 (25–36) |
34 (26–42) |
|
|
||
|
|
(n = 324) |
|
|
|
|
|
|
|
|
|
Extraprostatic |
27 (23–30) |
40 (35–45) |
48 (40–55) |
39 (31–48) |
|
|
|
|
|
extension |
|
|
|
|
|
|
|
|
|
(n = 165) |
|
|
|
|
|
|
|
|
|
Seminal vesicle (+) 2 (2–3) |
12(8–16) |
11 (7–17) |
17 (10–25) |
|
|
||
|
|
(n = 25) |
|
|
|
|
|
|
|
|
|
Lymph node (+) |
1 (0–1) |
6 (3–9) |
10 (5–17) |
9 (4–17) |
|
|
|
|
|
(n = 13) |
|
|
|
|
|
|
|
Clinical stage T2a (palpable < ½ of one lobe) (n = 998)
0–2.5 Organ confined 88 (84–90) 70 (63–77) 58 (48–67) 63 (51–74)
(n = 156)
Extraprostatic |
12 (9–15) |
24 (18–30) |
32 (24–41) |
26 (18–36) |
|
extension (n = 18) |
|
|
|
|
|
Seminal vesicle |
0 (0–1) |
2 (0–6) |
3 |
(0–7) |
4 (0–10) |
(+) (n = 2) |
|
|
|
|
|
Lymph node (+) |
0 (0–1) |
3 (1–9) |
7 |
(1–17) |
6 (1–16) |
(n = 1) |
|
|
|
|
|

210 |
CHAPTER 6 Urological neoplasia |
|
|
|
||||
|
|
Table 6.3 Continued |
|
|
|
|
|
|
|
|
|
|
|
|
|
|
|
|
|
PSA |
Pathological |
|
Biopsy Gleason Score |
|
|
|
|
|
range |
stage |
|
|
|
|
|
|
|
5–6 |
3 + 4=7 |
4 + 3 = 7 |
8–10 |
|||
|
|
(ng/mL) |
|
|||||
|
|
|
|
|
|
|
|
|
|
|
2.6–4.0 |
Organ confined |
79 (75–82) |
57 (51–63) |
45 (38–52) |
50 (40–59) |
|
|
|
|
(n = 124) |
|
|
|
|
|
|
|
|
Extraprostatic |
20 (17–24) |
37 (31–42) |
48 (40–55) |
40 (30–50) |
|
|
|
|
extension (n = 49) |
|
|
|
|
|
|
|
|
Seminal vesicle (+) 1 (0–1) |
5 (3–9) |
5 (3–10) |
8 (4–15) |
||
|
|
|
(n = 5) |
|
|
|
|
|
|
|
|
Lymph node (+) |
0 (0–0) |
1 (0–2) |
2 (0–5) |
2 (0–4) |
|
|
|
|
(n = 0) |
|
|
|
|
|
|
|
4.1–6.0 |
Organ confined |
71 (67–75) |
47 (41–52) |
34 (28–41) |
39 (31–48) |
|
|
|
|
(n = 171) |
|
|
|
|
|
|
|
|
Extraprostatic |
27 (23–31) |
44 (39–49) |
54 (47–60) |
46 (37–54) |
|
|
|
|
extension (n = 101) |
|
|
|
|
|
|
|
|
Seminal vesicle (+) 1 (1–2) |
7 (4–10) |
7 (4–11) |
11 (6–17) |
||
|
|
|
(n = 10) |
|
|
|
|
|
|
|
|
|
|
|
|
|
|
|
|
|
Lymph node (+) |
0 (0–1) |
2 (1–4) |
5 (2–8) |
4 (2–9) |
|
|
|
|
||||||
|
|
|
(n = 3) |
|
|
|
|
|
|
|
6.1–10.0 |
Organ confined |
68 (64–72) |
43 (38–48) |
31 (26–37) |
36 (27–44) |
|
|
|
|
(n = 142) |
|
|
|
|
|
|
|
|
Extraprostatic |
29 (26–33) |
46 (41–51) |
56 (49–62) |
47 (37–56) |
|
|
|
|
extension (n = 99) |
|
|
|
|
|
|
|
|
Seminal vesicle (+) 2 (1–3) |
9 (6–13) |
9 (5–14) |
13 (8–20) |
||
|
|
|
(n = 12) |
|
|
|
|
|
|
|
|
Lymph node (+) |
0 (0–1) |
2 (1–4) |
4 (2–8) |
4 (1–8) |
|
|
|
|
(n = 6) |
|
|
|
|
|
|
|
>10.0 |
Organ confined |
54 (49–60) |
28 (23–33) |
18 (14–23) |
21 (15–28) |
|
|
|
|
(n = 36) |
|
|
|
|
|
|
|
|
Extraprostatic |
41 (35–46) |
52 (46–59) |
57 (48–66) |
49 (39–59) |
|
|
|
|
extension (n = 47) |
|
|
|
|
|
|
|
|
Seminal vesicle (+) 3 (2–5) |
12(7–18) |
11 (6–17) |
17 (9–25) |
||
|
|
|
(n = 9) |
|
|
|
|
|
|
|
|
Lymph node (+) |
1 (0–3) |
7 (3–14) |
13 (6–24) |
12 (5–22) |
|
|
|
|
(n = 7) |
|
|
|
|
|
Clinical stage T2b (palpable ½ of lobe) or T2c (palpable both lobes) (n = 313)
0–2.5 |
Organ confined |
84 |
(78–89) 59 |
(47–70) |
44 (31–58) |
49 (32–65) |
|
|
(n = 16) |
|
|
|
|
|
|
|
Extraprostatic |
14 |
(9–19) |
24 |
(16–33) |
29 (19–42) |
24 (14–36) |
|
extension (n = 10) |
|
|
|
|
|
|

|
|
|
|
|
|
PROSTATE CANCER STAGING |
211 |
||||
|
Table 6.3 Continued |
|
|
|
|
|
|
|
|
|
|
|
|
|
|
|
|
|
|
|
|
|
|
|
PSA |
Pathological |
|
|
|
Biopsy Gleason Score |
|
|
|
|
|
|
range |
stage |
|
|
|
|
|
|
|
|
|
|
5–6 |
3 + 4=7 |
4 + 3 = 7 |
8–10 |
|
|
|||||
|
(ng/mL) |
|
|
|
|||||||
|
|
|
|
|
|
|
|
|
|
||
|
|
Seminal vesicle (+) 1 |
(0–3) |
6 (0–14) |
6 (0–14) |
8 (0–21) |
|
|
|||
|
|
(n = 0) |
|
|
|
|
|
|
|
|
|
|
|
Lymph node (+) |
1 |
(0–3) |
10(2–25) |
19 (4–40) |
17 (3–42) |
|
|
||
|
|
(n = 0) |
|
|
|
|
|
|
|
|
|
|
2.6–4.0 |
Organ confined |
|
74 (68–80) |
47 (39–56) |
36 (27–45) |
39 (28–50) |
|
|
||
|
|
(n = 28) |
|
|
|
|
|
|
|
|
|
|
|
Extraprostatic |
|
23 (18–29) |
37 (28–45) |
46 (36–55) |
37 (27–48) |
|
|
||
|
|
extension (n = 15) |
|
|
|
|
|
|
|
|
|
|
|
Seminal vesicle |
2 |
(1–5) |
13(7–21) |
13 (7–22) |
19 (9–32) |
|
|
||
|
|
(+)(n = 3) |
|
|
|
|
|
|
|
|
|
|
|
Lymph node (+) |
0 |
(0–1) |
3 (0–7) |
5 (0–14) |
4 (0–13) |
|
|
||
|
|
(n = 2) |
|
|
|
|
|
|
|
|
|
|
4.1–6.0 |
Organ confined |
|
66 (59–72) |
36 (29–43) |
25 (19–32) |
27 (19–37) |
|
|
||
|
|
(n = 46) |
|
30 (24–36) |
41 (33–47) |
47 (38–55) |
38 (28–48) |
|
|
||
|
|
|
|
|
|||||||
|
|
Extraprostatic |
|
|
|
||||||
|
|
|
|
||||||||
|
|
extension (n = 40) |
|
|
|
|
|
|
|
|
|
|
|
Seminal vesicle |
4 |
(2–6) |
16(10– 23) |
15 (9–23) |
22 (13–33) |
|
|
||
|
|
(+)(n = 7) |
|
|
|
|
|
|
|
|
|
|
|
Lymph node (+) |
1 |
(0–2) |
7 (3–12) |
13 (6–21) |
11 (4–23) |
|
|
||
|
|
(n = 4) |
|
|
|
|
|
|
|
|
|
|
6.1–10.0 |
Organ confined |
|
62 (55–68) |
32 (26–38) |
22 (17–29) |
24 (17–33) |
|
|
||
|
|
(n = 53) |
|
|
|
|
|
|
|
|
|
|
|
Extraprostatic |
|
32 (26–38) |
41 (33–49) |
47 (38–56) |
38 (29–48) |
|
|
||
|
|
extension (n = 28) |
|
|
|
|
|
|
|
|
|
|
|
Seminal vesicle (+) 5 |
(3–8) |
20 (13–28) |
19 (11–28) |
27 (16–39) |
|
|
|||
|
|
(n = 15) |
|
|
|
|
|
|
|
|
|
|
|
Lymph node (+) |
1 |
(0–2) |
6 (3–11) |
11 (5–19) |
10 (3–20) |
|
|
||
|
|
(n = 5) |
|
|
|
|
|
|
|
|
|
>10.0 |
Organ confined |
|
46 (39–53) |
18 (13–24) |
11 (7–15) |
12 (7–18) |
|
|
|||
|
|
(n = 8) |
|
|
|
|
|
|
|
|
|
|
|
Extraprostatic |
|
41 (34–50) |
40 (31–51) |
40 (30–52) |
33 (22–46) |
|
|
||
|
|
extension (n = 15) |
|
|
|
|
|
|
|
|
|
|
|
Seminal vesicle (+) 7 |
(4–12) |
23 (15–33) |
19 (10–29) |
28 (16–42) |
|
|
|||
|
|
(n = 10) |
|
|
|
|
|
|
|
|
|
|
|
Lymph node (+) |
5 |
(2–8) |
18(9–30) |
29(15–44) |
26 (12–44) |
|
|
||
|
|
(n = 8) |
|
|
|
|
|
|
|
|
|
|
|
|
|
|
|
|
|
|
|
|
|
Reprinted with permission from Makarov DV, Trock BJ, Humphreys EB, et al. (2007). Urology 69(6):1095–1101.