Материал: The_Future_of_Hydrogen-IEA-2020

The Future of Hydrogen |
Chapter 5: Opportunities for hydrogen in transport, buildings and power |
Flexible power generation
Hydrogen can be used as a fuel in gas turbines and CCGTs. Most existing gas turbine designs can already handle a hydrogen share of 3–5% and some can handle shares of 30% or higher. The industry is confident that it will be able to provide standard turbines that are able to run entirely on hydrogen by 2030 (EUTurbines, 2019).
Ammonia is another potential fuel for gas turbines. The direct use of ammonia has been successfully demonstrated in micro gas turbines with a power capacity of up to 300 kW (Shiozawa, 2019). In larger gas turbines above 2 MW, the slow reaction kinetics of ammonia with air, the flame stability and the NOx emissions are issues still being investigated by researchers (Valera-Medina et al., 2018). Instead of directly burning ammonia, an alternative approach is to reconvert the ammonia first into hydrogen and nitrogen, to burn hydrogen in the combustor of the gas turbine. The heat required for decomposing (or cracking) the ammonia at temperature levels of 600–1 000°C (the temperature depends on the catalyst) can be supplied by the gas turbine, though this slightly reduces the electricity generation efficiency of the overall process.
Fuel cells can also be used as a flexible power generation technology. With electric efficiencies of 50–60% (lower range today, upper future potential) being in a similar range to those of CCGTs, the choice between fuel cells and CCGTs in economic terms largely depends on their capital costs. It is, however, worth noting that fuel cell stacks today still suffer from a shorter technical lifetime than gas turbines (10 000 to 40 000 hours of operation), and that stationary fuel cells today typically have a smaller power output (up to 50 MW for the largest fuel cell power plants), which makes them most suitable for distributed generation. For comparison, CCGT units can reach capacities of 400 MW. The heat produced by the fuel cell while generating power can be used to provide an additional revenue stream. Future cost reductions for fuel cells will depend on future deployment levels and the learning effects and economies of scale that follow from this. On optimistic assumptions, CAPEX for hydrogen fuel cells may fall to USD 425/kW by 2030 compared to USD 1 600/kW for a 1 MW PEMFC unit today or USD 1 000/kW for a CCGT today (Bruce et al., 2018).
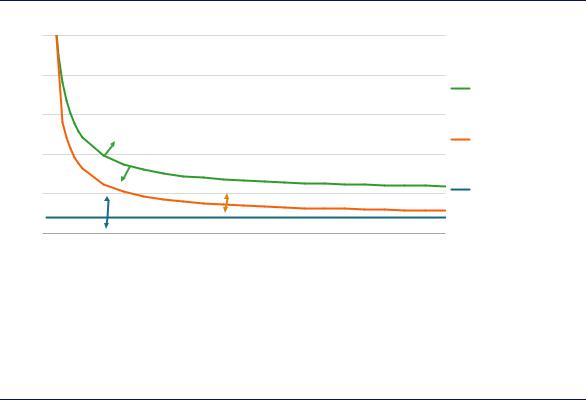
Hydrogen and ammonia could offer low-carbon flexibility for electricity systems with increasing shares of VRE. Alternative low-carbon flexible generation options are natural gasfired power plants equipped with CCUS and biogas power plants. Both alternatives are characterised by higher capital costs per unit of power than needed for a hydrogen-fired CCGT power plant, due to the additional capture equipment needed for CCUS and the typically smaller scale of biogas power plants. The capital cost advantage of the hydrogen option is more pronounced when the load factor is low (Figure 62), and it often is low in systems with high shares of VRE. At a capacity factor of 15%, low-carbon hydrogen would become competitive with electricity generation from natural gas with CCS at hydrogen prices of USD 2.5/kgH2, if the gas price is USD 7/MBtu.54
54 For comparison, USD 1/kgH2 corresponds to USD 8.8/MBtu.
PAGE | 156
IEA. All rights reserved.
The Future of Hydrogen |
Chapter 5: Opportunities for hydrogen in transport, buildings and power |
Figure 62. Break even for hydrogen CCGT against other flexible power generation options
USD/kgH2
10 |
|
|
|
|
|
|
|
|
|
|
|
8 |
|
|
|
|
|
|
|
|
|
|
Biogas plant, |
|
|
|
|
|
|
|
|
|
|
|
|
6 |
|
|
|
|
|
|
|
|
|
|
USD 14/MBtu |
|
|
|
|
|
|
|
|
|
|
|
|
|
|
Biogas cheaper |
|
|
|
|
|
|
Natural gas w/ CCUS, |
||
|
|
|
|
|
|
|
|
|
|
|
|
4 |
|
|
|
|
|
|
|
|
|
|
USD 7/MBtu |
|
Natural |
Hydrogen cheaper |
|
|
|
|
|
|
|||
2 |
gas without |
Natural gas with CCS cheaper |
|
Natural gas w/o CCUS, |
|||||||
CCS cheaper |
|
|
|
|
USD 7/MBtu |
||||||
|
|
|
|
|
|||||||
|
|
|
Hydrogen cheaper |
|
|
|
|
|
|||
0 |
|
|
Hydrogen cheaper |
|
|
|
|
|
|
||
|
|
|
|
|
|
|
|
|
|
|
|
|
0% |
10% |
20% |
30% |
40% |
50% |
60% |
70% |
80% |
90% |
100% |
|
|
|
|
|
|
Load factor |
|
|
|
|
|
Notes: Arrows indicate areas where hydrogen costs and load factors mean that competing generation technologies or hydrogen are cheaper. CAPEX = USD 1 000/kW for CCGT without CCS and hydrogen-fired CCGT, USD 1 870/kW for CCGT with CCS, USD 2 000/kW for biogas engine; gross efficiencies (LHV) = 61% CCGT without CCS and hydrogen-fired CCGT, 53% CCGT with CCS, 45% biogas engine. Economic lifetime = 25 years. More information on the assumptions is available at www.iea.org/hydrogen2019.
Source: IEA 2019. All rights reserved.
Hydrogen may be cost-competitive with natural gas with CCS and biogas as a flexible generation option, particularly at low load factors.
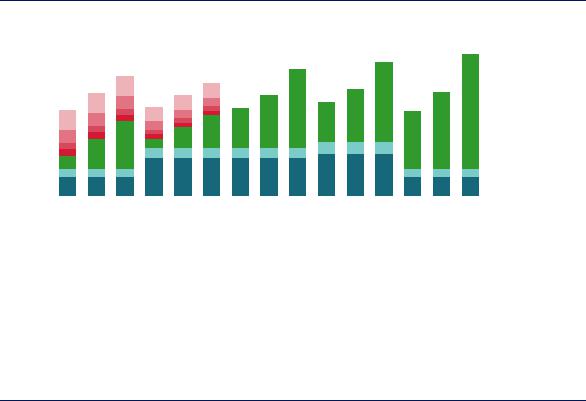
The competitiveness of hydrogen-fired power plants with natural gas-fired power generation for load balancing and peak load generation depends on the gas price and the potential level of carbon prices. Looking, for example, at a load factor of 15% and a natural gas price of USD 7/MBtu, the CO2 price would have to be USD 100/tCO2 to make hydrogen-fired power generation at a hydrogen price of USD 1.5/kgH2 competitive with natural gas. If the hydrogen price was USD 2/kg H2, the CO2 price would have to be USD 175/tCO2 to make electricity from hydrogen competitive against natural gas (Figure 63).
For illustrative purposes, if 1% of the globally installed gas-fired power capacity (or 25 GW) was fired by hydrogen (or ammonia) in 2030, this would result in annual electricity generation of around 90 TWh (40% load factor) and hydrogen demand of 4.5 MtH2 (or 30 Mt of ammonia). This would help to scale up demand and the supply infrastructure for hydrogen, since the annual hydrogen demand of 25 GW of hydrogen power plants would correspond to the annual consumption of around 23 million fuel cell vehicles. Even a single 500 MW power plant would create a hydrogen demand equivalent to 455 000 fuel cell vehicles or the heat demand of 221 000 homes in the United Kingdom, and might therefore provide an opportunity to create a hub for other potential hydrogen users, such as transport or buildings.
PAGE | 157
IEA. All rights reserved.
The Future of Hydrogen Chapter 5: Opportunities for hydrogen in transport, buildings and power
Figure 63. |
|
Levelised electricity generation costs for load balancing from natural gas and hydrogen |
|||||||||||||||||||||||||||
USD/MWh |
300 |
|
|
|
|
|
|
|
|
|
|
|
|
|
|
|
|
|
|
|
|
|
|
|
|
|
|
|
USD 175/tCO |
|
|
|
|
|
|
|
|
|
|
|
|
|
|
|
|
|
|
|
|
|
|
|
|
|
|
|
|||
250 |
|
|
|
|
|
|
|
|
|
|
|
|
|
|
|
|
|
|
|
|
|
|
|
|
|
|
|
||
|
|
|
|
|
|
|
|
|
|
|
|
|
|
|
|
|
|
|
|
|
|
|
|
|
|
|
|
||
|
|
|
|
|
|
|
|
|
|
|
|
|
|
|
|
|
|
|
|
|
|
|
|
|
|
|
|
||
|
|
|
|
|
|
|
|
|
|
|
|
|
|
|
|
|
|
|
|
|
|
|
|
|
|
|
|
USD 100/tCO |
|
|
|
|
|
|
|
|
|
|
|
|
|
|
|
|
|
|
|
|
|
|
|
|
|
|
|
|
|
||
|
200 |
|
|
|
|
|
|
|
|
|
|
|
|
|
|
|
|
|
|
|
|
|
|
|
|
|
|
|
|
|
|
|
|
|
|
|
|
|
|
|
|
|
|
|
|
|
|
|
|
|
|
|
|
|
|
|
|
||
|
|
|
|
|
|
|
|
|
|
|
|
|
|
|
|
|
|
|
|
|
|
|
|
|
|
|
|
USD 50/tCO |
|
|
|
|
|
|
|
|
|
|
|
|
|
|
|
|
|
|
|
|
|
|
|
|
|
|
|
|
|
||
|
|
|
|
|
|
|
|
|
|
|
|
|
|
|
|
|
|
|
|
|
|
|
|
|
|
||||
|
|
|
|
|
|
|
|
|
|
|
|
|
|
|
|
|
|
|
|
|
|
|
|
|
|
|
|
||
|
150 |
|
|
|
|
|
|
|
|
|
|
|
|
|
|
|
|
|
|
|
|
|
|
|
|
|
|
|
USD 25/tCO |
|
|
|
|
|
|
|
|
|
|
|
|
|
|
|
|
|
|
|
|
|
|
|
|
|
|
|
|
||
|
|
|
|
|
|
|
|
|
|
|
|
|
|
|
|
|
|
|
|
|
|
|
|
|
|
|
|
||
|
|
|
|
|
|
|
|
|
|
|
|
|
|
|
|
|
|
|
|
|
|
|
|
|
|
|
|
Fuel costs |
|
|
100 |
|
|
|
|
|
|
|
|
|
|
|
|
|
|
|
|
|
|
|
|
|
|
|
|
|
|
|
|
|
|
|
|
|
|
|
|
|
|
|
|
|
|
|
|
|
|
|
|
|
|
|
|
|
|
|
|
||
|
|
|
|
|
|
|
|
|
|
|
|
|
|
|
|
|
|
|
|
|
|
|
|
|
|
|
|
||
|
|
|
|
|
|
|
|
|
|
|
|
|
|
|
|
|
|
|
|
|
|
|
|
|
|
|
|
OPEX |
|
|
|
|
|
|
|
|
|
|
|
|
|
|
|
|
|
|
|
|
|
|
|
|
|
|
|
|
|
||
|
|
|
|
|
|
|
|
|
|
|
|
|
|
|
|
|
|
|
|
|
|
|
|
|
|
|
|
|
|
|
50 |
|
|
|
|
|
|
|
|
|
|
|
|
|
|
|
|
|
|
|
|
|
|
|
|
|
|
|
CAPEX |
|
|
|
|
|
|
|
|
|
|
|
|
|
|
|
|
|
|
|
|
|
|
|
|
|
|
|
|
||
|
|
|
|
|
|
|
|
|
|
|
|
|
|
|
|
|
|
|
|
||||||||||
|
|
|
|
|
|
|
|
|
|
|
|
|
|
|
|
|
|
|
|
|
|
|
|
|
|
|
|
||
0 |
|
|
|
|
|
|
|
|
|
|
|
|
|
|
|
|
USD 3/MBtu |
USD 7/MBtu |
USD 11/MBtu |
USD 3/MBtu |
USD 7/MBtu |
USD 11/MBtu |
USD 1.5/kgH |
USD 2/kgH |
USD 3/kgH |
USD 1.5/kgH |
USD 2/kgH |
USD 3/kgH |
USD 1.5/kgH |
USD 2/kgH |
USD 3/kgH |
||
|
||||||||||||||||
|
|
GT NG |
|
|
CCGT NG |
|
|
CCGT H |
|
|
FC H |
|
|
GT H |
|
Notes: GT = gas turbine; CCGT = combined-cycle gas turbine; FC = fuel cell; NG = natural gas. CAPEX = USD 500/kW GT, USD
1 000/kW CCGT without CCS and hydrogen-fired CCGT, USD 1 000/kW FC. Gross efficiencies (LHV) = 42% GT, 61% CCGT without CCS and hydrogen-fired CCGT, 55% FC. Economic lifetime = 25 years for GT and CCGT, 20 years for FC. Capacity factor = 15%. More information on the assumptions is available at www.iea.org/hydrogen2019.
Source: IEA 2019. All rights reserved.
Whether hydrogen-based power generation for load balancing can compete on price against natural gas depends on regional hydrogen, natural gas and CO2 prices.
Large-scale and long-term storage
The integration of increasing shares of VRE sources in the electricity system requires a more flexible electricity system. High shares of renewables can create a need for long-term and seasonal storage, for example to provide electricity during periods of several days with very little wind and or sunshine.
Hydrogen and hydrogen-based fuels (such as methane, liquid organic hydrogen carriers [LOHCs] and ammonia produced from electricity via electrolysis) are potential options for longterm and large-scale storage of energy. Salt caverns are the best choice for the underground storage of pure hydrogen because of their tightness and low risk of contamination. Alternative underground hydrogen storage options such as pore storage and storage in depleted oil and gas fields are also being investigated. Converting electricity into methane via power-to-gas is a further long-term storage option, and one which could take advantage of the existing transport and storage infrastructure for natural gas. Around 70 power-to-gas projects to produce methane are in operation today, most of them in Europe (Chapter 2). Storing electricity in the form of ammonia is another long-term and large-scale storage option. Large steel tanks are already commonly used in the fertiliser industry for storing ammonia.
Hydrogen-based storage options suffer from low round-trip efficiency: in the process of converting electricity through electrolysis into hydrogen and then hydrogen back into electricity, around 60% of the original electricity is lost, whereas for a lithium-ion battery the losses of a storage cycle are around 15% (Figure 64). Pumped-hydro storage facilities offer one alternative: they have been used for more than a century to store electricity for relatively long periods. Batteries offer another alternative, although they are unlikely to be used for long-term and large-scale storage because they suffer from self-discharge and because of the immense number of batteries that would be needed for large-scale storage. A single large refrigerated
PAGE | 158
IEA. All rights reserved.
The Future of Hydrogen |
Chapter 5: Opportunities for hydrogen in transport, buildings and power |
liquid ammonia tank with a diameter of 50 metres and a height of 30 metres, as typically used in the fertiliser industry, can store energy amounting to 150 GWh, comparable to the annual electricity consumption of a city with a population of 100 000. To store the same amount of electricity with batteries would require around 1 150 times the installation of the Australian Hornsdale Battery Reserve, the largest lithium-ion battery storage today in the world with a capacity of 129 MWh.
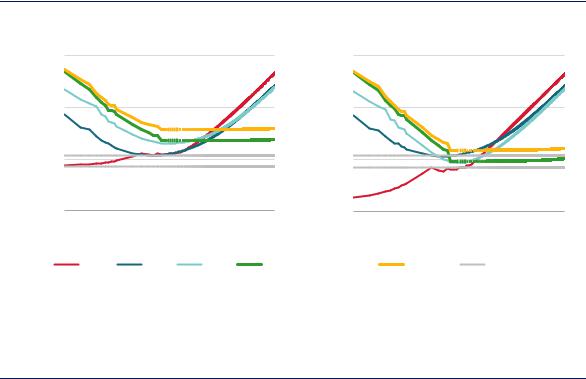
All the alternatives have advantages and disadvantages. For shorter discharge durations below a few hours, hydrogen and ammonia are much more expensive than pumped-hydro storage or battery storage. With longer discharge durations, compressed hydrogen and ammonia become more attractive, benefitting from their relative low capital costs for energy storage volumes (the investment costs to develop underground salt caverns or storage tanks). Among the different storage technologies considered here, compressed hydrogen becomes the most economic option for discharge durations beyond 20–45 hours.
Figure 64. |
Levelised costs of storage as a function of discharge duration |
|
|
|
|||||||
|
10 000 |
Electricity input costs USD 50/MWh |
|
|
10 000 |
Electricity input costs USD 0/MWh |
|
||||
USD/MWh |
|
|
|
|
USD/MWh |
|
|
|
|
||
1 000 |
|
|
|
|
1 000 |
|
|
|
|
||
|
|
|
|
|
|
|
|
|
|
||
|
100 |
|
|
|
|
|
100 |
|
|
|
|
|
10 |
|
|
|
|
|
10 |
|
|
|
|
|
0.1 |
1 |
10 |
100 |
1000 |
|
0.1 |
1 |
10 |
100 |
1000 |
|
|
Discharge duration (h) |
|
|
|
Discharge duration (h) |
|
||||
|
|
Li-Ion |
PHES |
CAES |
Compressed hydrogen |
Ammonia |
|
CCGT with CCUS |
|||
Notes: PHES = pumped-hydro energy storage; CAES = compressed air energy storage; Li-Ion = lithium-ion battery. Compressed hydrogen storage refers to compressed gaseous storage in salt caverns, ammonia storage to storage in tanks.
Source: IEA 2019. All rights reserved.
Depending on the costs of the stored electricity, compressed hydrogen storage becomes the most economic storage option at discharge durations longer than 20–45 hours.
Hydrogen as an electricity storage option could also be combined with other uses of hydrogen in the interests of competitiveness. In the United States, for example, the Three-State Generation and Transmission utility is considering producing ammonia from electricity for the domestic fertiliser market. Situated in an area with low-cost electricity from wind, solar and hydropower, the project would use a reversible solid oxide electrolyser cell (rSOEC) to produce hydrogen when the cost of electricity is less than USD 25/MWh (which is 85% of the time), turning it into ammonia for sale on the market, while storing some of it for electricity generation in the rSOEC during peak hours, thus improving its overall utilisation rate. This approach may be an alternative to installing new electric generation resources that are expected only to be needed during peak load times.
It may not be necessary to use large-scale storage of hydrogen-based fuels to cover the full storage cycle, i.e. taking electricity as input and converting it in the end back into electricity.
PAGE | 159
IEA. All rights reserved.
The Future of Hydrogen |
Chapter 5: Opportunities for hydrogen in transport, buildings and power |
Instead of filling long-term storage with hydrogen from domestic electricity, hydrogen-based fuels can also be imported from other parts of the world with seasonal surpluses of renewable electricity generation at that time, taking advantage of complementary seasonal patterns of renewable electricity supply and electricity demand. Depending on the frequency and scale of the imports, this could reduce the storage volumes needed in the importing region. The conversion back to electricity may also not always be needed. Stored methane, ammonia or hydrogen could be directly used as fuel to cover seasonal demands, such as for space heating.
References
ACEA (European Automobile Manufacturers Association) (2018), “ACEA report: Vehicles in use Europe 2018”, www.acea.be/uploads/statistic_documents/ACEA_Report_Vehicles_in_useEurope_2018.pdf.
ACTU (2019), “Hyundai prévoit finalement 1 600 camions hydrogènes pour la Suisse et l’Europe” [Hyundai finally expects 1 600 hydrogen trucks for Switzerland and Europe], www.actu-transport- logistique.fr/routier/hyundai-prevoit-finalement-1-600-camions-hydrogenes-pour-la-suisse-et- leurope-517674.php.
AFC TCP (Advanced Fuel Cells Technology Collaboration Programme) (2019), “AFC TCP Survey on the Number of Fuel Cell Electric Vehicles, Hydrogen Refuelling Stations and Targets”, provided to IEA by AFC TCP.
AFHYPAC (2017), “100 Véhicules à hydrogène déployés dan le cadre du Projet H2ME” [100 hydrogen vehicles deployed in the framework of the H2ME project], www.afhypac.org/newsletter/65/100- vehicules-a-hydrogene-deployes-dans-le-cadre-du-projet-h2me-104/.
Airbus (2000), “Cryoplane – Hydrogen fuelled aircraft”, http://staffwww.itn.liu.se/~clryd/KURSER/TNK027/Kurslitteratur2011/CRYOPLANE.pdf.
AirClim (2018), “Norway heading for zero-emission ships”, www.airclim.org/acidnews/norway-heading- zero-emission-ships.
Alstom (2018), “World premiere: Alstom’s hydrogen trains enter passenger service in Lower Saxony”, https://www.alstom.com/press-releases-news/2018/9/world-premiere-alstoms-hydrogen-trains- enter-passenger-service-lower.
Ammonia Energy (2018), “GenCell launches commercial alkaline fuel cell using cracked ammonia fuel”, www.ammoniaenergy.org/gencell-launches-commercial-alkaline-fuel-cell-using-cracked- ammonia-fuel/.
Baronas, J. et al. (2017), “Joint Agency Staff Report on Assembly Bill 8: 2016 Assessment of time and cost needed to attain 100 hydrogen refueling stations in California”, www.energy.ca.gov/2017publications/CEC-600-2017-002/CEC-600-2017-002.pdf.
Baroutaji, A. et al. (2019), “Comprehensive investigation on hydrogen and fuel cell technology in the aviation and aerospace sectors”, Renewable and Sustainable Energy Reviews, Vol. 106, pp. 31-40.
Brown, T (2018), “Pilot project: an ammonia tanker fueled by its own cargo” Ammonia Energy, www.ammoniaenergy.org/pilot-project-an-ammonia-tanker-fueled-by-its-own-cargo/.
Bruce, S. et al. (2018), National Hydrogen Roadmap, CSIRO, Australia.
Campíñez-Romero, S. et al. (2018), “A hydrogen refuelling stations infrastructure deployment for cities supported on fuel cell taxi roll-out”, Energy, https://doi.org/10.1016/j.energy.2018.02.009.
PAGE | 160
IEA. All rights reserved.