Материал: The_Future_of_Hydrogen-IEA-2020

The Future of Hydrogen |
Chapter 5: Opportunities for hydrogen in transport, buildings and power |
These potential applications could be attractive in a wide range of countries where the provision of heat is important and where it is has to be provided in large part to existing buildings. Buildings that are more than 25 years old (and that typically have energy-intensive heating loads) represent around three-quarters of the total buildings stock in the European Union, for example (FCH 2 JU, 2019), while around two-thirds of buildings in the United States and Canada were built before 1990 (OEE, 2018; EIA, 2015; EIA, 2012). Existing buildings, many of them decades old, will continue to represent a sizeable share of the overall buildings stock in the future (Table 7). This means that a certain level of heat demand is already largely “locked in” for several decades to come.
One major advantage of hydrogen blends, direct hydrogen use and indirect hydrogen use for district heating and cooling is that they can make use of existing infrastructure. While technically feasible, other potential solutions would require major new infrastructure, which would inevitably be very costly.
Another major advantage is that hydrogen use in buildings could potentially find synergies with the wider energy system that make it attractive in terms of the overall system cost of lowcarbon transitions. Other potential solutions might find this a tougher challenge. For instance, full electrification of heat, even using high-efficiency heat pumps, could lead to large seasonal imbalances in power demand, especially if major building energy efficiency improvements are not delivered in parallel (IEA, 2019c). This would potentially require large-scale peak power or energy storage capacity. Partially or entirely replacing natural gas with biomethane also has limitations: in the European Union, for example, natural gas use for heat in buildings represented around 90 times biomethane production in 2016 (EBA, 2017). Global biogas production would need to increase 20-fold to meet current natural gas demand in the buildings sector.
|
Table 7. |
The global buildings stock and share of gas in heat production in 2017 |
|
|
||||||||||
|
|
|
|
|
|
|
|
|
|
|
|
|
|
|
|
|
|
|
|
Floor area |
|
|
Heat demand per |
|
|
Share of natural |
|
Estimated share of |
|
|
Region |
|
|
|
|
|
|
|
|
existing buildings |
|
|||
|
|
|
|
(billion m2) |
|
|
capita, MWh |
|
|
gas in heat |
|
|
||
|
|
|
|
in 2050 stock |
|
|||||||||
|
|
|
|
|
|
|
|
|
|
|
|
|
|
|
|
|
|
|
|
|
|
|
|
|
|
||||
|
North America* |
|
|
37 |
|
|
7.6 |
|
|
61% |
|
55% |
|
|
|
European Union* |
29 |
|
7.2 |
|
43% |
|
57% |
|
|||||
|
|
|
|
|
|
|
|
|
|
|
|
|
||
|
Other advanced |
|
|
13 |
|
|
4.9 |
|
|
33% |
|
53% |
|
|
|
economies* |
|
|
|
|
|
|
|
|
|
||||
|
|
|
|
|
|
|
|
|
|
|
|
|
|
|
|
Russia* |
|
|
5 |
|
10.7 |
|
35% |
|
55% |
|
|||
|
|
|
|
|
|
|
|
|
|
|
|
|||
|
China* |
|
|
|
58 |
|
|
2.2 |
|
|
17% |
|
50% |
|
|
India |
|
|
21 |
|
0.4 |
|
4% |
|
17% |
|
|||
|
|
|
|
|
|
|
|
|
|
|
|
|||
|
Africa |
|
|
|
21 |
|
|
0.3 |
|
|
10% |
|
18% |
|
|
Latin America |
12 |
|
1.0 |
|
27% |
|
32% |
|
|||||
|
|
|
|
|
|
|
|
|
|
|
|
|
||
|
Other emerging |
|
|
39 |
|
|
1.2 |
|
|
44% |
|
31% |
|
|
|
economies* |
|
|
|
|
|
|
|
|
|
||||
|
|
|
|
|
|
|
|
|
|
|
|
|
|
|
|
World |
|
|
235 |
|
2.4 |
|
41% |
|
39% |
|
|||
* Indicates markets with major heating demand as a share of total final energy consumption in the buildings sector. Russia = the Russian Federation; China = the People’s Republic of China.
Notes: m2 = square metre. Excludes traditional use of solid biomass and does not include natural gas use in production of commercial heat.
Source: IEA 2019. All rights reserved.
PAGE | 146
IEA. All rights reserved.

The Future of Hydrogen |
Chapter 5: Opportunities for hydrogen in transport, buildings and power |
Blending hydrogen into natural gas for heating
In major heating markets like Canada, the United States and Western Europe, blending low shares of hydrogen – 3–5% hydrogen by volume – into supplied natural gas would have little impact on end-use equipment such as boilers and gas cookstoves. As described in Chapter 3, 20% blend shares in 14 buildings in Ameland (the Netherlands) found no problems with leakage, flame stability, back firing or ignition, nor were there problems with pipes or heating equipment at 30%. Other projects around the world have tested specific pieces of equipment, with similar conclusions.
Rigorous testing to ensure system safety, efficiency and environmental performance in the long run would nonetheless be required as the general tolerance of domestic appliances at higher blends cannot be assumed, especially for older equipment. In parallel, it would make sense to ensure that any infrastructure or equipment upgrades were compatible with a possible switch to higher shares of hydrogen.
Blending hydrogen can create dependable demand for hydrogen through its early deployment phase, but managing the cost impacts is a key challenge for policy makers. Taking an illustrative example, if hydrogen were blended into all natural gas use around the world at just 3% by volume, this would boost clean hydrogen demand by close to 12 MtH2/yr. This would be a significant scaleup of hydrogen supply, equivalent to about 17% of current global dedicated hydrogen production. This could potentially have a major impact on the costs of hydrogen supply technologies through expansion of manufacturing and installation, but would add around 3–15% to natural gas supply costs. Many markets are currently close to the tipping point between gas and electricity prices that could trigger a switch to higher-performance heat pump technologies – including hybrid or gas thermal heat pumps – where they are appropriate, especially for new construction (Figure 59). Increases in gas prices resulting from blending mandates or incentives would risk losing gas customers, something to be considered in policy design.
Figure 59. Spread of energy prices, performance and operational costs for gas and electric heating equipment in IEA countries, 2017
USDper kWh-eq |
0.5 |
|
|
|
|
|
|
|
|
|
|
|
Seasonalefficiency factor |
7.5 |
|
|
|
|
|
|
|
|
USDper kWh-eq |
0.25 |
|
|
|
|
|
|
|
|
|
|
|
|
|
|
|
|
|
|
|
|
|
|
|
|
|
|
|
|
|
|
|
|
|
|
|||||||||||
|
|
|
|
|
|
|
|
|
|
|
|
|
|
|
|
|
|
|
|
|
|
|||||||||||||
0.2 |
|
|
|
|
|
|
|
|
|
|
|
3 |
|
|
|
|
|
0.1 |
|
|
|
|
|
|
|
|
|
|
||||||
|
|
|
|
|
|
|
|
|
|
|
|
|
|
|
|
3.10 |
|
|
|
|
|
|
|
|
|
|
||||||||
|
0.4 |
|
|
|
|
|
|
|
|
|
|
|
|
6 |
|
|
|
|
|
|
|
|
|
0.2 |
|
|
|
|
|
|
|
|
|
|
|
0.3 |
|
|
|
|
|
|
|
|
|
|
0.23 |
|
4.5 |
|
|
|
|
|
|
|
|
|
0.15 |
|
|
|
|
|
|
|
|
|
|
|
|
|
|
|
|
|
|
|
|
|
|
|
|
|
|
|
|
|
|
|
|
|
|
|
|
|
|
|
|
|||||
|
|
|
|
|
|
|
|
|
|
|
|
|
|
|
|
|
|
|
|
|
|
|
|
|
|
|
|
|
|
|||||
|
|
|
|
|
|
|
|
|
|
|
|
|
|
|
|
|
|
|
|
|
|
|
|
|
|
|
|
|
|
|
|
|
|
|
|
0.1 |
|
|
|
|
|
|
|
|
|
|
|
|
1.5 |
|
|
|
|
|
|
|
|
|
|
|
|
|
|
0.08 |
|
|
|
0.07 |
|
|
|
|
|
|
|
|
|
|
|
|
|
|
|
|
|
|
|
|
|
|
|
|
|
|
|
|||||||||
|
|
|
|
|
|
|
|
|
|
|
|
|
|
|
|
|
|
|
|
|
|
0.05 |
|
|
|
|
|
|
|
|
|
|
||
|
|
|
|
0.08 |
|
|
|
|
|
|
|
|
|
|
|
|
|
|
|
|
||||||||||||||
|
|
|
|
|
|
|
|
|
|
|
|
|
|
|
0.92 |
|
|
|
|
|
|
|
|
|
|
|
|
|
|
|
||||
|
0 |
|
|
|
|
|
|
|
|
|
|
|
|
|
|
|
|
|
|
|
|
|
|
|
|
|
|
|
|
|
|
|||
|
|
|
|
|
|
|
|
|
|
|
|
|
|
|
|
|
|
|
|
|
|
|
|
|
|
|
|
|
|
|||||
|
|
|
|
|
|
|
|
|
|
|
|
|
0 |
|
|
|
|
|
|
|
|
|
0 |
|
|
|
|
|
|
|
|
|
|
|
|
|
Natural gas |
Electricity |
|
|
Gas boiler |
Electric heat |
|
|
|
|
|
|
|
|
|
|
|
||||||||||||||||
|
|
|
|
|
|
|
|
Gas boiler |
Electric heat |
|||||||||||||||||||||||||
|
|
|
|
|
|
|
|
|
|
|
|
|
|
|
|
|
|
|
pump |
|
|
|
|
|
|
|
|
pump |
||||||
|
|
|
|
|
Energy prices |
|
|
|
Energy performance |
|
|
|
|
Operational cost |
||||||||||||||||||||
Notes: kWh-eq = kilowatt hour equivalent. Prices are residential prices, including taxes, in USD 2017 using purchasing power parities. Source: IEA 2019. All rights reserved.
Relative gas and electricity prices are finely poised in many countries between levels that would make heat pumps or gas boilers the most cost-effective for new installations.
PAGE | 147
IEA. All rights reserved.
The Future of Hydrogen |
Chapter 5: Opportunities for hydrogen in transport, buildings and power |
Shares higher than 20% hydrogen in the natural gas network could be achieved through hydrogen-based fuels. However, injecting synthetic methane, which would avoid the need to replace existing equipment in most instances, would likely raise gas prices much higher than pure hydrogen blends per unit of energy delivered.
100% hydrogen use for heating
From the perspective of costs, 100% hydrogen use in buildings (e.g. via a fuel cell or hydrogen boiler) appears most attractive for relatively large commercial buildings or building complexes, and for district energy networks. Fuel cells, co-generation units or other hybrid systems could be used in such cases with energy storage capacity (provided by thermal storage or via a district energy network) to meet heating, cooling and electricity demand, taking advantage of on-site renewables or low electricity prices. Fuel cell and co-generation technologies could equally be used in district energy networks, which when paired with storage (either thermal or hydrogen) could improve power system balancing across the year, avoiding large seasonal peaks and enabling greater flexibility in the grid. Paired with large-scale heat pumps, those district energy solutions could also dramatically increase the overall efficiency of heat production for buildings.
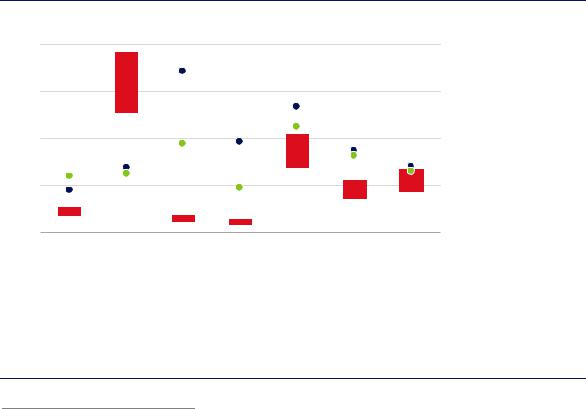
For the broader buildings market, particularly for residential housing, the prospects for hydrogen conversion in the longer term will depend on several critical factors, notably hydrogen price and technology cost. Prices of hydrogen delivered to consumers would likely need to be in the range of USD 1.5–3.0/kgH2 in many major heating markets for hydrogen to compete with natural gas boilers and electric heat pumps (Figure 60).52 Higher final prices in the range of USD 3–4/kgH2 might still be competitive with natural gas prices in some countries or for some building types (and eventual CO2 pricing would narrow that spread), while in other countries with low gas prices, such as Canada, prices would probably need to be below USD 1/kgH2.
Figure 60. Potential hydrogen demand for heating in buildings and spread of competitive energy prices in selected markets, 2030
Mt
8
6
4
2
0
Canada |
United |
Japan |
Korea |
Western |
Russia |
China |
|
States |
|
|
Europe |
|
|
4 |
per kg) |
|
|
3 |
price (USD |
2 |
Hydrogen |
|
1
0
 Hydrogen
demand
 Competitive with gas boiler (right axis)
 Competitive with electric heat pump (right axis)
Notes: Prices are average retail prices, including taxes, in USD 2017. Natural gas demand is for space heating and hot water production and includes building envelope improvements to 2030 under a Paris-compatible pathway. Competitiveness of electric heat pumps assumes a typical seasonal efficiency of the heat pump in those countries. Price competitiveness does not include capital costs of the equipment.
Source: IEA 2019. All rights reserved.
Final energy prices for hydrogen are likely to have to be in the range USD 1.5–3.0/kgH2 in major heating markets in order to compete with natural gas and electricity in providing heat in buildings.
52 This also depends on the type of heat pump, its efficiency in the prevailing climate and the building’s energy performance.
PAGE | 148
IEA. All rights reserved.

The Future of Hydrogen |
Chapter 5: Opportunities for hydrogen in transport, buildings and power |
It will not necessarily be enough for a product to offer lower running costs over time if it is more expensive at the outset. Consumers often give more weight to upfront purchase prices than to overall lifetime costs. Heating equipment costs vary substantially depending on factors such as unit capacity, brand, availability in local markets and overall size of product demand. In addition, consumer preference will also matter on issues such as safety and ease of installation. Moreover some types of building will be better suited to the use of hydrogen than others. Large-scale co-generation, for example, may be more cost-effective in terms of both capital and operational expenditure for large commercial buildings than for small-scale residential ones. Similarly, large-scale fuel cell co-generation may be well-suited to the supply of renewable electricity to buildings adapted with high-performance heat pumps and clean district heat (as a replacement for hard-to-convert gas-based systems), but less well-suited to other types of buildings.
If 100% hydrogen is ultimately able to compete in terms of capital and operational costs in some markets, the market potential in buildings is very large indeed. Heat demand will inevitably remain central to energy demand in buildings, even in a low-carbon context. In a Paris-compatible pathway, heat demand would be expected to represent more than half of global building energy consumption in 2030, with about 500 Mtoe of natural gas used for space and water heating in buildings annually. Of this, theoretical potential hydrogen demand might be on the order of 12–20 MtH2/yr in key markets (Canada, the United States, Western Europe, Japan, Korea, the Russian Federation [“Russia”] and China) if all gas boiler equipment installed or replaced at expected stock turnover rates between today and 2030 were hydrogen-ready (Table 8). Combining this with low-concentration hydrogen blends in the wider natural gas grid gives an upper bound of 14– 24 MtH2 global hydrogen demand in 2030.
Table 8. 2030 natural gas demand for heat in buildings and indicative theoretical hydrogen demand in selected regions
|
|
|
|
|
Natural gas demand |
|
Competitive price range |
|
Indicative hydrogen |
|
|
Region |
|
|
|
|
for hydrogen |
|
|
||
|
|
|
|
(Mtoe) |
|
|
demand (MtH2) |
|
||
|
|
|
|
|
|
(USD/kgH2) |
|
|
||
|
|
|
|
|
|
|
|
|
|
|
|
|
|
|
|
|
|||||
|
Canada |
|
|
|
21 |
|
0.8–1.2 |
|
0.7–1.1 |
|
|
|
|
|
|
|
|
|
|
|
|
|
United States |
147 |
|
1.2–1.5 |
5.1–7.7 |
|||||
|
|
|
|
|
|
|||||
|
Western Europe |
|
|
|
80 |
|
2.0–3.0 |
|
0.5–0.7 |
|
|
|
|
|
|
|
|
|
|
|
|
|
Japan |
14 |
|
2.0–3.5 |
0.4–0.6 |
|||||
|
|
|
|
|
|
|||||
|
Korea |
|
|
|
11 |
|
0.9–1.9 |
|
2.8–4.2 |
|
|
|
|
|
|
|
|
|
|
|
|
|
Russia |
43 |
|
1.5–1.8 |
1.5–2.2 |
|||||
|
|
|
|
|
|
|||||
|
China |
|
|
|
51 |
|
1.2–1.4 |
|
1.8–2.7 |
|
|
|
|
|
|
|
|
|
|
|
|
Notes: Natural gas demand is for space heating and hot water production and takes account of building envelope improvements under a Paris-compatible pathway. Indicative demand assumes that hydrogen production, transmission and distribution is within the competitive range shown here and does not include potential hydrogen demand for hydrogen-based fuels. Excludes natural gas use in production of commercial heat. Western Europe includes France, Germany, Italy and the United Kingdom. Indicative of direct hydrogen use in buildings. The indicative demand takes into account typical lifetimes of existing heating equipment in buildings and does not assume early retirement of equipment.
Source: IEA 2019. All rights reserved.
PAGE | 149
IEA. All rights reserved.
The Future of Hydrogen |
Chapter 5: Opportunities for hydrogen in transport, buildings and power |
Achieving these levels of hydrogen use in buildings, and potentially higher levels in the longer term, faces several barriers. These include higher upfront capital costs and higher energy prices for consumers, as well as any safety concerns that consumers may have. In the near term, demonstration projects with strong public and private participation can continue to help identify and find ways of overcoming these barriers, especially if they provide practical information based on:
Urban development patterns. For example, most current demonstration projects are not located in the types of urban areas where most heat demand is and which are generally more challenging to supply with hydrogen. Similarly, demonstration buildings are often single-occupancy or low-density commercial or multifamily residential units that do not illustrate the practical application of hydrogen equipment in dense urban environments or in older buildings where electric or hybrid electric-natural gas heat pumps may be less appropriate, making them a key target opportunity for hydrogen.
Building types. Large-scale co-generation, for instance, may be more cost-effective in terms of both CAPEX and OPEX for large commercial buildings than for small-scale residential ones. Large-scale fuel cell co-generation may also be well-suited to the supply of renewable electricity to buildings equipped with high-performance heat pumps and clean district heat (as a replacement for hard-to-convert gas-based systems), but less suited to other types of buildings.
Realising the potential for hydrogen use in buildings and moving to the use of low-carbon hydrogen will require co-ordination between policy makers, industry and investors, as well as greater engagement with consumers and with the equipment service sector. Installers, for example, may require training or specific skills. Governments can help to facilitate dialogue and remove potential obstacles to the use of hydrogen by measures such as improving policy regulations; providing clear signals about their expectations for the future carbon intensity of heat (including ambitious targets to decarbonise natural gas networks); continuing to improve the evidence base on hydrogen applications for heat in buildings; and supporting innovation.
Hydrogen for power generation and electricity storage
Hydrogen plays a negligible role in the power sector today: it accounts for less than 0.2% of electricity generation. This is linked mostly to the use of gases from the steel industry, petrochemical plants and refineries. But there is potential for this to change in the future. Cofiring of ammonia could reduce the carbon intensity of existing conventional coal power plants, and hydrogen-fired gas turbines and combined-cycle gas turbines could be a source of flexibility in electricity systems with increasing shares of variable renewables. In the form of compressed gas, ammonia or synthetic methane, hydrogen could also become a long-term storage option to balance seasonal variations in electricity demand or generation from renewables (Table 9).
PAGE | 150
IEA. All rights reserved.