Материал: Крючков Фундаменталс оф Нуцлеар Материалс Пхысицал Протецтион 2011

absorption of gamma-quanta in uranium or plutonium may be highly intensive.
If a standard point source contains т0 grams of NM, the mass of the point deposit m (g) is found from the formula:
m = m0 |
× |
C |
× |
r |
2 |
, |
(5.4) |
|
|
|
|
||||||
C |
r |
2 |
||||||
|
|
|
|
|
||||
|
|
0 |
|
0 |
|
|
||
where С is the count rate in the deposit measurement, and r is the distance from the detector to the deposit.
Where there is a linear deposit distribution, the NM mass per the deposit length unit mL (g/m) is found from the expression:
mL |
= |
m0 |
× |
C |
× |
r |
. |
(5.5) |
LE |
|
|
||||||
|
|
|
C0 r0 |
|
||||
If a planar deposit distribution model is chosen, the NM mass per the deposit area unit mA (g/m2) is found from the formula:
mA |
= |
m0 |
× |
C |
. |
(5.6) |
AE |
|
|||||
|
|
|
C0 |
|
||
Gamma ray spectrometry of uranium enrichment
There are two definitions of the uranium enrichment by 235U isotope:
·enrichment (mass percent) Е1=(mass of 235U/total mass of U) 100%;
·enrichment (atomic percent) Е2=(number of 235U atoms/total number of U atoms)×100%.
Commonly used are analyses of uranium enrichment based on the assumption that the intensity of gamma radiation of 235U from uranium
samples of a sufficient thickness is proportional to the enrichment thereof by 235U. Gamma-quanta with the energy of 185.7 keV in 235U decays are
emitted with a probability of (57.5±0.9)% (the quantum yield of radiation*, the number of quanta of the said radiation reaches 4.6×10⁴ quantum/(s×g)).
* “Branching ratio” is the term often used in foreig n literature.
236
Mean free paths and “infinite“ thicknesses for quan ta of 185.7 keV in uranium compounds are given in Table 5.4.
Table 5.4
Mean free paths and “infinite” thicknesses for gamm a radiation of 185.7 keV in uranium compounds
|
|
|
Density, |
|
Infinite |
|
No. |
Compound |
Mean free path, cm |
thickness, |
|||
g/cm3 |
||||||
|
|
|
|
|
cm |
|
1 |
Metal |
18.7 |
0.04 |
0.26 |
||
2 |
UF6 (solid) |
4.7 |
0.20 |
1.43 |
||
3 |
UO2 |
(caked) |
10.9 |
0.07 |
0.49 |
|
4 |
UO2 |
(powder) |
2.0 |
0.39 |
2.75 |
|
5 |
Uranyl nitrate |
2.8 |
0.43 |
3.04 |
||
Method description
The detector (Fig. 5.5) records the radiation transmitted through the filter and the collimator. The detector-visible surface area is determined with the aid of a collimator. The filter absorbs radiation in the region of the energies below 185.7 keV, which enables the measuring path to be unloaded and the share of 185.7-keV signals in the total flow of signals via the path to be increased. The filters are made of average-weight materials (Cd, Ni and others).
The pulse count rate in the photopeak nр=Sph/t, where Sph is the count of pulses in the photopeak and t is the measurement time, is determined by the following expression:
nр = (Ωd / 4π )ελ235 (N A / AU ) ρU EIθ exp(− µf ρf df ) ×
D |
(5.7) |
|
× exp(− µc ρc dc )∫exp(−μℓ x)dx, |
||
|
||
0 |
|
where Ωd is the solid angle limited by the collimator aperture; ε is the efficiency of the detector at Еγ =185.7 keV; NA is the Avogadro number; АU is the atomic mass of uranium in the sample; ρU is the density of the uranium in the sample; Е is the enrichment; I is the quantum yield (branching ratio) for the irradiation of 185.7 keV; θ is the collimator aperture area; μf, ρf, df are the filter mass attenuation factor, density and
237
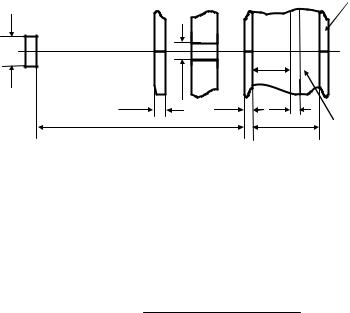
thickness; μc, ρc, dc are the container mass attenuation factor, density and thickness; μℓ is the attenuation factor for the gamma radiation in the uranium sample; and λ235 is the 235U decay constant.
Filter |
Collimator |
|
Container |
Detector |
|
|
|
2r |
|
x |
|
|
|
|
|
|
r |
|
|
d |
d |
dx |
|
l |
|
D |
Uranium sample |
|
|
|
in container |
Fig. 5.5. Schematic geometry of uranium enrichment for the sample gamma radiation
Following the calculation of the integral and transformations (and a more detailed representation of the sample composition), the formula (5.7) is reduced to the following form:
|
E ×ТC ×Тff ×(1-Тsam ) |
|
n |
р = K × [1+ (μM / μU ) ×(ρM / ρU )], |
(5.8) |
where K = [(Wd / 4π ) ×ε ×λ235 × I × AU ×Tf ]; Тsam is the transmission factor for the examined sample; Тc is the transmission factor for the container wall; Тf is the filter transmission factor; μU, ρU is the uranium mass attenuation factor and density; and μM, ρM is the matrix mass attenuation factor and density.
The term [1+ (μM M / μU ) ×(ρM / ρU )] accounts for the uranium dilution
in the sample by other materials (oxygen, fluorine, plutonium, etc.). It depends on the composition of the measured material.
K is found with the aid a physical standard and the value thereof turns into the calibration factor. Therefore, the enrichment value sought for is obtained from the formula:
238
E = |
nр ×[1+ (μM / μU ) ×(ρM / ρU )] |
. |
(5.9) |
|
|||
|
K ×ТC ×Тf ×(1-Тsam ) |
|
|
Now we shall compare the measurements with NaIand Ge-
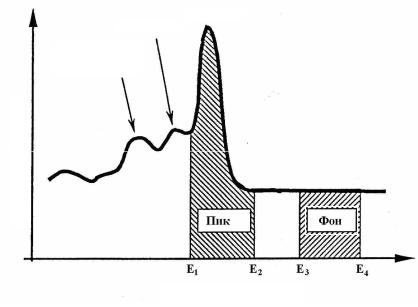
spectrometers. The portion of the spectrum obtained on a NaI-spectrometer in the region of the 235U peak of 185.7 keV is shown in Fig. 5.6.
The count of pulses in the photopeak Sph = p – f ×b where p is the total count of pulses in the preset range of energies Е1– Е2 that includes the photopeak of 185.7 keV; b is the total count of background pulses in the range above the peak (see Fig. 5.6); and f is the factor of scaling between the measured background in the peak region. The background is estimated via extrapolation by the numbers of counts in the channels above the peak.
In analyses of infinitely thick samples Е=nр/K=А×p+В×b, where А and В (В = –f ×А) are calibration factors found by measurements with a standard.
There is no problem with the background subtraction during measurements on semiconductor Ge-detectors. The peaks are approximately 20 times as narrow as during measurements based on NaIdetectors, so the peak/background relation is accordingly higher.
Number of counts
185.7 keV
143-164 keV
X-ray
|
|
Back- |
|
Peak |
|||
|
ground |
||
|
Energy, keV
Fig. 5.6. Gamma radiation spectrum measured by NaI-detector
239

Measurement of the 235U and 238U gamma radiation relative intensity
The major drawback of the uranium enrichment measurement method based on recording of 185.7keV radiation is the requirement to have the measuring system calibrated for each new container with the uranium sample. No such drawback is present in measurements of enrichment from the relative intensity of 235U and 238U gamma radiations.
The gamma radiation spectrum has three energy ranges that can be used for such measurements: 53–68 keV, 84–130 keV and 18 5–1001 keV.
The region of 84–130 keV includes a series of γ- and ХK-lines of uranium isotopes. Radiations of 235U and 238U in this region are very close by energy and so are detected with nearly the same efficiency.
The relation between the concentrations of isotopes in the sample is obtained from the formula:
Ni Nk = nip nkp ×Т1i / 2 Т1k/ 2 × Iγk Iγi × e kγ eiγ , |
(5.10) |
where Ni, Nk are the numbers of the atoms of respectively the i-th and k-th isotopes in the sample; Т1i/ 2 , Т1k/ 2 are the half-lives of respectively the i-th and k-th isotopes; εγi , εγk are the efficiencies of radiation detection in the
analyzed peaks of respectively the i-th and k-th isotopes, which include, in the given case, the detector efficiency, the geometry of the measurements, self-absorption of radiations in the sample and attenuation of same in the
material between the sample and the detector; and Iγi , Iγk are the quantum
yields of the radiations as detected in the analyzed peaks of respectively the i-th and k-th isotopes.
The count rate nip and the concentration of the i-th isotope relate as follows:
nip |
|
N i × ln 2 |
|
i |
|
|
|
|
|
×εγ . |
(5.11) |
i |
= |
i |
|
||
Iγ |
|
T 1/ 2 |
|
|
|
The term in brackets has the same value for all gamma radiations emitted by one isotope. So the relation ( nip / Iγi ) is proportional to the efficiency
εγi . The relative efficiency measurement procedure includes:
240