Материал: Крючков Фундаменталс оф Нуцлеар Материалс Пхысицал Протецтион 2011
∙determination of the count rates nip in a series of peaks that belong to
one isotope and calculation of |
the values nip / Iγi |
that |
characterize the |
|
efficiency εγi . The |
quantities |
Iγi are known for |
each |
group of quanta |
forming these peaks |
Si; |
|
|
|
∙the obtained values εγi for a series of peaks are used to plot the
dependence of εγ on Еγ .
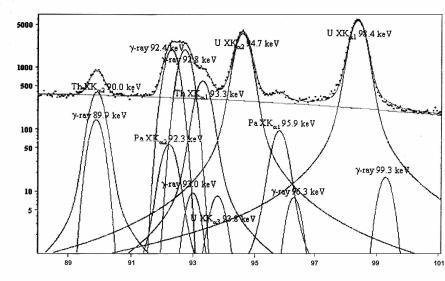
The biggest difficulty involved in handling the range of 84–130 keV, that is similarity of the radiations measured by energies, is coped with by using high-resolution Ge-detectors and a special spectrum decomposition
program called MGAU (Fig. 5.7).
To determine the relative content of 235U, X-ray peaks of 89.95 keV (Th XKα2) and 93.35 keV (Th XKα1) are used. For 238U, a doublet of overlapped gamma peaks of 92.37 keV and 92.79 keV (234Th) is used.
The content of 234U is found from the gamma-ray line of 121 keV. The enrichment determination error makes not more than several percent for
uranium samples in a range from depleted to highly enriched uranium (from 0.3% to 93% of 235U).
inCount pulchannel,
Energy, keV
Fig. 5.7. Uranium radiation spectrum in the energy range 88–100 keV and the outcome of its mathematical decomposition into separate components
241

Constraints: the gamma doublet of 92.37 keV and 92.79 keV used to determine the relative content of 238U belongs to 234Th, which is the product of the α-decay of 238U. Therefore, the daughter 234Th in the sample should be in equilibrium with the parent 238U, which occurs only in approximately 5 months after the chemical isolation of uranium. The container wall thickness influences the accuracy of analysis: a 16-mm wall of a steel container with UF6 attenuates the radiation of 90–100 keV by a factor of approximately 250.
Nondestructive gamma ray spectrometry measurements of plutonium isotopic composition
Most of the Pu samples contain 238Pu, 239Pu, 240Pu, 241Pu and 242Pu. Besides, these always include 241Am and 237U, which are the products of 241Pu decay. Data on the decays of the above isotopes are presented in Table 5.5.
Table 5.5
Decay data of selected isotopes
Isotope |
Т1/2, years |
Activity, |
|
decay/s×g |
|||
|
|
||
238Pu |
87.74±0.04 |
6.33×10¹¹ |
|
239Pu |
24119±26 |
2.2942×10⁹ |
|
240Pu |
6564±11 |
8.3971×10⁹ |
|
241Pu |
4.348±0.022 |
3.8244×10¹² |
|
242Pu |
376300±900 |
1.4522×10⁸ |
|
241Am |
433.6±1.4 |
1.2655×10¹¹ |
|
237U |
6.75 days |
9.4080×10⁷ |
* Given there is equilibrium with 241Pu.
Gamma measurements determine the isotopic relations of f238/f239,
f240/f239, f241/f239, f242/f239, with the total of f238+f239+f240++f241+f242=1, where
fi is the fraction of the i-th plutonium isotope. Possible compositions of Pu isotopes are presented in Table 5.6.
If to measure the intensities of gamma radiations from the isotopes contained in a sample, self-calibration may help determine the relative efficiencies of the detection thereof. Self-calibration technique is based on using a series of peaks of one isotope contained in the analyzed sample, and on the quantum yield data.
242

|
|
|
|
|
Table 5.6 |
|
Possible isotopic compositions of plutonium |
|
|
||||
|
|
|
|
|
|
|
Isotope |
238Pu |
239Pu |
240Pu |
241Pu |
242Pu |
|
|
|
|
|
|
|
|
Low burnup, % |
0.01 |
94 |
5.5 |
0.5 |
0.03 |
|
|
|
|
|
|
|
|
High burnup, % |
2 |
57 |
25 |
11 |
5 |
|
|
|
|
|
|
|
|
The sample mass may vary from 100 mg to the limits imposed by nuclear safety and security considerations. The matrix can be any (solid, liquid, powder, heterogeneous). There are no geometry restrictions. The age from the time of the Pu chemical isolation can be also any. Both planar and coaxial Ge-detectors can be used for measurements.
There are different ranges of gamma-ray energies that contain radiations of plutonium isotopes. Within all ranges, helpful data can be found in the peaks of various isotopes which are close by energy. Measurements in highenergy regions enable the Pu contained inside thick-wall containers to be measured without having the sample taken out. This results in a higher safety of the operator and makes it possible to inspect sealed containers used for long-term NM storage.
To measure samples of a large mass, one can use radiations with the energies 642.5 keV for 240Pu, 646.0 keV for 239Pu and 766.4 keV for 238Pu,
which are highly penetrable and enter the detector from across the sample thickness.
Measurements of samples in thin-wall containers are done in lowenergy regions with the aid of planar Ge-detectors. Coaxial detectors are used both for thin-wall and thick-wall containers.
Planar detectors with an area of 200–500 mm 2 and a thickness of 10–13 mm are often used. Such dimensions offer a compromise, which is helpful in getting a good resolution and an acceptable efficiency.
Use of planar detectors is confined to the region of ≤400 keV. Measurements in higher-energy regions need a coaxial detector with a
Minimum reported quantity.
243
resolution of ≤1.7 keV for the peak of the 60Со calibration source of the energy 1332 keV.
Test measurements of plutonium samples are conducted based on MGA and FRAM codes.
MGA (multi-group analysis) is a code to determine the isotopic composition of Pu from results of gamma ray spectrometry measurements in the energy range of 99–104 keV. All intensive ga mma peaks and X-ray peaks in this region are used. No entry of data (coming from the analog-to- digital converter or ADC) or efficiency calibration is required.
The code has the following drawbacks:
∙there is a problem of identifying 242Pu that cannot be measured directly due to a very low intensity of its gamma radiation. A complete analysis of
plutonium composition requires either a destructive analysis (mass spectrometry) or estimation of the 242Pu content by isotopic correlation method;
∙it is not applicable where there is a strong background of fission fragments and to measurements of samples in thick-wall containers.
Using FRAM code requires the sample gamma radiation spectrum measured on equipment with a high energy resolution and a set of parameters to be used for the analysis. The parameters control the search for peaks and specify the analysis scope and the isotopes to be determined.
FRAM code features:
∙ease of adaptation to various measurement conditions with no need for reprogramming;
∙a user capability to edit the analysis parameters;
∙a capability of analyzing all kinds of samples having the following contents (2–38% of 240Pu, 0.01–50% of 241Am) and samples in thick-wall containers.
Table 5.7 gives data on accuracies in nondestructive measurements of plutonium isotopic compositions.
Table 5.7
Accuracy of nondestructive measurements for plutonium isotopic compositions, %
Еγ, range, keV |
Тmeas |
238Pu |
239Pu |
240Pu |
241Pu |
40–60 |
10–300 min |
0.3–5.0 |
0.05–0.5 |
0.2–1.0 |
0.2–1.0 |
90–105 |
30–60 min |
0.3–5.0 |
0.05–0.5 |
0.2–1.0 |
0.2–0.8 |
>120 |
1–4 h |
1–10 |
0.1–0.5 |
1–5 |
0.3–0.8 |
244
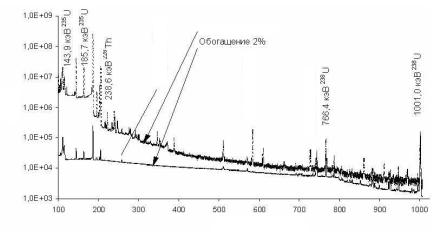
FRAM can be also used to examine uranium samples, specifically to test enrichments of uranium articles inside a container. The thing is that commonly used MGAU-based analyses rely on soft radiation measurements and are not suitable for testing shielded samples. Using FRAM enables use of harder radiations for analyses by measuring the spectrum thereof with the aid of a coaxial НРGe-detector. Fig. 5.8 presents the radiation spectra for differently enriched uranium samples obtained with the aid of a coaxial HPGe-detector.
|
U |
|
U |
|
|
|
|
235 |
|
235 |
|
|
U |
|
keV |
|
keV |
|
|
|
|
|
|
|
238 |
||
Count |
|
|
Th |
|||
143.9 |
|
185.7 |
|
keV238.6 |
258.4keV |
|
|
|
|
|
|
228 |
|
|
|
|
|
|
|
|
Enrichment 45% |
|
|
|
|
Enrichment 2% |
|
|
|
|
Th |
|
|
|
U |
Th |
U |
|
238 |
|
228 |
228 |
238 |
|
|
583.1keV |
727.3 keV |
766.4 keV |
|
1001.0keV |
|
|
|||
|
|
|
|
Energy, keV
Fig. 5.8. Spectra of uranium sample radiation
Standards have quite different roles in gamma ray spectrometry measurements of Pu (and U) isotopic compositions as compared to other nondestructive test techniques. The values sought for in gamma ray spectrometry are obtained using certain physical constants and selfcalibration results. Standards are used just to control measurement results.
Analyses of NM solutions. Densitometry
K-edge or L-edge densitometry (KED or LED) is based on measuring the transmission of a highly collimated photon or gamma-quanta beam from an external source through an NM solution sample. The technique is practically insensitive to the radiation emitted by the sample itself (for example, high content of fission products in the solution is allowable). The
245