Материал: Крючков Фундаменталс оф Нуцлеар Материалс Пхысицал Протецтион 2011

collimator confines observation to only a small sample portion. For this reason, the sample should be strictly homogeneous throughout the thickness. K-edge or L-edge densitometer is the instrument for nondestructive assays of NM concentrations in solutions (Fig. 5.9).
Detector
S  D
D
Source
Collimator |
Sample |
Collimator |
|
|
|
Fig. 5.9. Diagram of densitometry measurements
The absorption factor for each element is measured in steps with the energies being equal to the energies of the electron coupling on the K- and L- shells of atoms (Table 5.8).
Measuring the transmission of one-energy radiation through a sample may give information on the content of one material or one component of a mixture. Using a radiation of two different energies makes it possible to control the composition of a two-component mixture.
Table 5.8
Energy of electron coupling on K- and L-shells in various NM, keV
Element |
Th |
U |
Np |
Pu |
Am |
K-edge |
109.56 |
115.61 |
118.68 |
121.82 |
125.03 |
L-edge |
16.3 |
17.2 |
17.6 |
18.0 |
18.5 |
A measurement of еру transmission with two energies Е1 and Е2 yields a system of equations for two unknown concentrations:
(- ln T1) / x = M1 = μ11 × ρ1 + μ12 × ρ2 |
|
(5.12) |
|
. |
|
(- ln T2 ) / x = M 2 = μ12 × ρ1 + μ22 × ρ2 |
|
|
The solution to the equations looks as follows:
246
ρ1 |
= (M1 × μ22 - M 2 |
× μ21 ) / D |
(5.13) |
|
|
, |
|
ρ2 = (M 2 × μ11 - M1 × μ12 ) / D |
|
||
where D = μ11 × μ22 - μ12 × μ12 .
The more accurate is the solution, the more nonzero is the quantity D. This condition is fulfilled if two radiations near and on both sides of the heavy mixture component absorption K-edge (or L-edge) are used. With even the absorption factors of a light components differing slightly at these energies, the difference of D will be rather great.
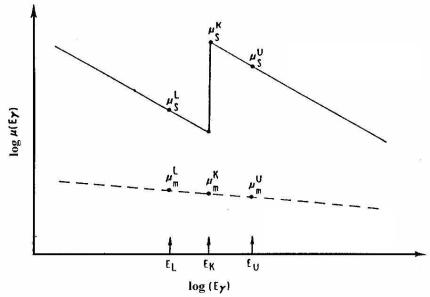
We shall consider in detail the changes of μ (Е) near the К-electron absorption edge (Fig. 5.10).
Heavy component material
Light component material
Fig. 5.10. Changes in the absorption factors of a heavy and a light NM component near the K-edge
By measuring the transmission of γ-radiations with the energies of ЕL and ЕU, we find the concentration of NM in the solution ρs sought for:
247
ρs = |
1 |
ln( |
TL |
) + ρm ( Dμm ) , |
(5.14) |
|
DμS × x |
TU |
|||||
|
|
Dμs |
|
where Dμs = μsU - μsL >0, Dμm = μmU - μmL <0.
If ЕL and ЕU are very close to ЕK, then Dμm is tending towards zero, and the measurement result is insensitive to the absorption in the matrix.
Extra measurements (calibrations) are done with reference solutions placed in standard containers.
If NM concentrations are small (dozens of g/l), L-edge densitometry is used; where higher NM concentrations are involved (hundreds of g/l), K- edge densitometry is employed.
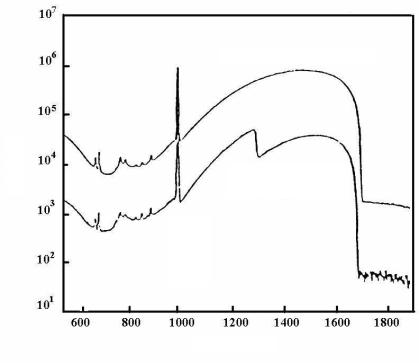
Two types of radiation sources are used: the first one is X-ray generators that produce photons with a continuous broad spectrum. These are used both in K-edge and L-edge measurements. Examples of spectra are given in Fig. 5.11. The relation of the sample spectrum to the comparison spectrum gives the transmission.
The second type of employed sources is represented by radioactive g- sources of monoenergy radiations. For example, plutonium solutions (Ек=121.82 keV) are measured using two sources: 75Se (Т1/2=120 days,
Еγ=121.1 keV) and 57Со (Т1/2=270 days, Еγ=122 keV). The result of the absorption in a light-weight matrix during measurements with these sources is influenced negligibly, still different decay rates thereof should be taken into account.
Measurements of uranium solutions (Ек = 115.61 keV) use the ytterbium-196 (169Yb) g-source with a half-life of Т1/2 = 32 days. In this case, no allowance for decay is required to be made because one source emits both quanta groups. However, a major difference in the energies thereof (EL = 109.8 keV, EU = 130.5 keV) causes a great sensitivity to the absorption in the matrix (high Dμm).
248
Count
Comparison spectrum
Uranium spectrum 197 g/l
88.04 keV Cd-109
Channels
Fig. 5.11. Spectrum of solutions obtained with the aid of an X-ray generator: the upper curve is the comparison spectrum measured by a K-edge densitometry detector in an NM-free solution (3-mol solution of HNO3); the lower curve is the spectrum of an uranium solution sample with a concentration of 197 g/l; the 109Cd source is used to correct the counting losses caused by dead-time
L-edge analyses are used for samples of a smaller thickness, this being dictated by a smaller penetrating power of the radiations measured. L-edge densitometry (LED) is normally used to control solutions with smaller concentrations of NM, and K-edge densitometry (KED) is used for higher concentrations (Table 5.9). With lower NM concentrations in solutions, an X-ray fluorescence analysis is used.
Table 5.9
Representative NM concentrations in solutions for densitometry analyses
Representative concentrations, g/l |
Uranium |
Plutonium |
ρS (KED) |
270 |
294 |
ρS (LED) |
18 |
19 |
249 |
|
|
Analyses of NM solutions. X-ray fluorescence analysis (XFA)
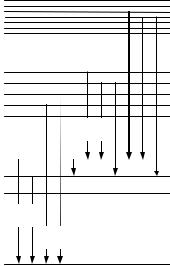
All atoms have ordered systems of electron shells that are characterized by particular values of binding energy. Where a vacancy emerges on an electron shell, it is filled with another electron passing from a higher shell (Fig. 5.12). The difference of potential energies is liberated as an X-ray quantum with the energy equal to the difference of binding energies on the lower and the upper shells. The characteristic radiation spectra are fairly simple, this making it easier to analyze these.
To release the electron from the shell, one needs to give it the energy in excess of Еbinding. To do this, outer excitation sources are used.
The probability of exciting an X-ray source of a K (or L) series depends on the difference between the excitation source quanta energy Е0 and the K–(or L)–shell electron binding energy Еbinding. The excitation probability reaches the maximum when the gamma-quantum energy exceeds the electron binding energy just slightly.
VII
N
I
|
L α1 |
α2 |
|
|
|
|
|
|
|
|
|
γ1 |
|
||
|
β1 |
β2 |
|
|
|||
|
|
|
|
|
|
||
|
|
|
|
|
|
|
|
V
K α1 α2
β3 β1
M
Fig. 5.12. Diagram of the electron transitions in an atom
Radioactive sources or X-ray tubes are used to excite characteristic radiation. The advantages of radioactive sources are a simple design and stability of the exciting radiation energy. The exciting radiation spectrum
250