Материал: Крючков Фундаменталс оф Нуцлеар Материалс Пхысицал Протецтион 2011
should be as simple as possible. In the event of a complex spectrum, there are “inactive” high-energy lines that create the ba ckground in the region of measured X-rays or even interfere with these.
Table 5.10 gives the values of the Pu and U X-ray energy and yields.
|
|
|
|
|
|
Table 5.10 |
|
Values of the Pu and U transition energies and X-ray yields |
|||||||
|
|
|
|
|
|||
Line |
Transition |
Uranium, % |
Plutonium, % |
|
|||
Kα1 |
K-L3 |
98.44 |
(100) |
103.76 |
(100) |
|
|
Kα2 |
K-L2 |
94.66 |
(61.9) |
99.55 |
(62.5) |
|
|
Kβ1 |
K-M3 |
111.31 (22.0) |
117.26 |
(22.2) |
|
||
Kβ3 |
K-M2 |
110.43(11.6) |
116.27 |
(11.7) |
|
||
Lα1 |
L3-M5 |
13.62 |
(100) |
14.28 |
(100) |
|
|
Lα2 |
L3-M4 |
13.44 |
(10) |
14.08 |
(10) |
|
|
Lβ2 |
L3-N5 |
16.43 |
(20) |
17.26 |
(20) |
|
|
Lβ1 |
L2-M4 |
17.22 |
(50) |
18.29 |
(50) |
|
|
To observe representative peaks, one needs to choose the proper measurement geometry. Observations may be hampered by the background created by the quanta resulting from the source’s Compton radiation scattering.
The i-th element X-ray quanta detection rate nфi relates to the content of this element Ni in the sample and the quantum yield of its radiation
IiX through the following:
|
|
|
n |
|
= N |
i |
× I X ×W X |
× eX |
, |
|
(5.15) |
|||||
|
|
|
|
Φ i |
|
|
i |
|
i |
i |
|
|
|
|
||
where Wi X |
is the X-ray excitation function which is the product of the |
|||||||||||||||
photoeffect |
cross-section |
σ Fi (E) |
and |
the source quanta flux onto the |
||||||||||||
sample Фγ (Е); and εiX |
is the efficiency of X-ray detection: |
]× dE , |
|
|||||||||||||
W X = |
∞siФ(E) ×Ф |
γ |
(E) × dE = (Z |
)5 |
× ∞[Ф |
γ |
(E) /(E - E )3 |
(5.16) |
||||||||
i |
∫ |
|
|
|
|
|
|
i |
|
∫ |
|
i |
|
|
||
|
Ei |
|
|
|
|
|
|
|
|
|
Ei |
|
|
|
|
|
where Еi is the threshold energy of photoeffect on the respective electron shell (K or L) of the i-th element, and Zi is the atomic number of the i-th element.
251
Obviously, excitation function depends strongly on the Z element and the more, the closer is the energy of the excitation source to the photoeffect threshold energy (the electron binding energy on the shell).
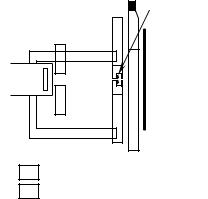
Radioactive gamma sources have small dimensions. They are also simple to handle and fit for many XFAs. The major deficiency involved in these is disintegration thereof over time and the requirement to have them periodically replaced. There is also a transportation problem. As the power of such sources is over 1 mCi, handling them requires shielding of both personnel and the detector. An XFA facility layout is shown schematically in Fig. 5.13.
As with passive gamma measurements, the XFA data accuracy may be limited by the absorption inside the sample. This effect is to be taken into account both for the characteristic radiation measured and for the exciting radiation of the external source. The absorption in large-size and solid samples is so great that XFA is not appropriate for analyzing such samples. So it is used to control liquid homogeneous samples.
The source radiation absorption is more intensive as the radiation energy exceeds the absorption threshold for the NM analyzed. Attenuation depends also on the material and the thickness of the container walls. An XFA to study L-radiation requires using plastic rather than metallic containers.
The XFA measuring system is calibrated using a set of reference solutions with different NM concentrations in containers, these being of the same type as used for the solutions under examination.
57Co source
Removable uranium foil
Detector shielding
Solution sample
Lead
Aluminum
Fig. 5.13. Schematic of an XFA facility
252
X-ray generator has more power than radioactive sources. It generates 1012 photons/s and more. The major complications involved in using generators are the requirement to keep high stability of the parameters thereof and relatively large dimensions that make it difficult to move them.
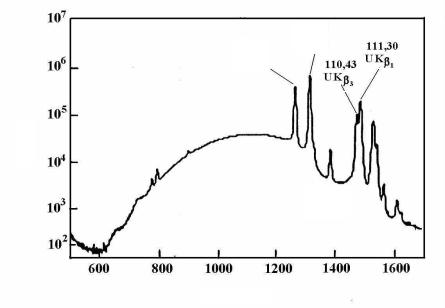
X-ray fluorescence measurements help determine the relation of NM concentrations in a solution. Fig. 5.14 gives the spectrum of a solution with a content of uranium and plutonium.
|
98.44 |
|
|
||
|
UKα1 |
|
|
||
94.66 |
111.30 |
||||
UKα2 |
|
|
|
UKβ1 |
|
110.43 |
|||||
|
|
|
|||
|
|
UKβ3 |
|
|
|
Count
103.73 Pu Kα1
Channels
Fig. 5.14. Fluoresecence spectra of uranium and plutonium solutions
The U/Pu weight relation can be found from the areas of the XKα1 peak for uranium (SU) and the XKα1 peak for plutonium (SPu):
U / Pu = |
AU |
× |
S U |
× |
ε Pu |
× |
1 |
, |
(5.17) |
APu |
S Pu |
ε U |
RU / RPu |
where AU and APu are the atomic masses of uranium and plutonium, (εPu/εU) is the relative efficiency of uranium and plutonium detection; and (RU/RPu) is the factor allowing for the difference in the probabilities of uranium and plutonium radiations being excited using the given source.
253
Neutron measurements of NM
There are three processes causing neutron irradiation of NM samples:
∙spontaneous NM fission;
∙induced NM fission;
∙(α, n) – a reaction induced by NM α-radiation.
Neutrons are highly penetrating particles. They go out from all over the sample and pass easily through the walls of the container with the sample.
Spontaneous fission is most likely for isotopes with an even mass number (238Pu, 240Pu, 242Pu and others). The relative probability of 240Pu
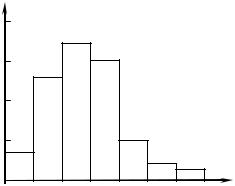
fission with emission of a different number of neutrons is shown in Fig. 5.15. The average number of neutron/fission is about 2. Altogether, there are 473 spontaneous fissions per second occurring in 1 g of 240Pu.
Fission |
fraction |
0.4
0.3
0.2
0.1
0.0
0 |
1 |
2 |
3 |
4 |
5 |
6 |
Number of neutrons
Fig. 5.15. Relative probability of fissions with emission of different neutron numbers
The number of neutrons generated by one fission is called multiplicity. In total, 1 g of 240Pu has 473 spontaneous fissions per second taking place therein.
254

The technique based on detection of spontaneously emitted neutrons is called passive.
Handling of passive neutron measurement results often includes the notion of “effective” 240Pu which is believed to account for all neutron radiation of a plutonium sample:
240Pueff=2.52× f238+f240+1.68×f242, |
(5.18) |
where fi is the fraction of the i-th plutonium isotope in the sample.
Induced fission is most likely for fissile isotopes (235U, 239Pu, 241Pu). Induced fission generates 0–8 neutrons per fission. In the event of 239Pu, the average number of these is about 3. The neutron measurement method using an external source is called active.
More neutrons may be generated in spontaneous or induced fission as the result of the multiplication thereof in the sample. The (a,n)-reaction is an extra source of neutrons that hampers neutron measurements of NM. Radioactive decays of uranium and plutonium isotopes are commonly accompanied by emission of a-particles. The energies of the emitted a- particles are from 4 to 6 MeV. A major source of a-particles is also 241Am.
Alfa-particles emitted by uranium and plutonium react with 11 elements with a small atomic number Z, including oxygen, fluorine, carbon and aluminum.
One neutron is generated as the result of the (a, n)-reaction. Cases of single ((a,n)-reactions) and multiple (spontaneous and induced fission) neutron generations may be divided by detecting time coincidences of neutrons.
Helium counters are commonly employed to detect neutron in NM test measurements. The reaction taking place in such counters is the (n, p)- reaction:
3He + n ® 3H + 1H + 765 keV |
(5.19) |
The 3He(n,p) reaction cross-section for thermal neutrons reaches 5330 barns and varies in a broad energy range (10-2 to 105 eV) according to the
law 1/ 
 E .
E .
For higher efficiency of fast neutron counting, the counter has a moderator made around it. The 3He-counter is normally placed in a 10-cm thick polyethylene block.
255